Business communications software company 8x8 (NYSE: EGHT) met Wall Street’s revenue expectations in Q4 CY2024, but sales fell by 1.2% year on year to $178.9 million. On the other hand, next quarter’s revenue guidance of $178 million was less impressive, coming in 2% below analysts’ estimates. Its non-GAAP profit of $0.11 per share was 27.6% above analysts’ consensus estimates.
Is now the time to buy 8x8? Find out by accessing our full research report, it’s free.
8x8 (EGHT) Q4 CY2024 Highlights:
- Revenue: $178.9 million vs analyst estimates of $179.3 million (1.2% year-on-year decline, in line)
- Adjusted EPS: $0.11 vs analyst estimates of $0.09 ($0.02 beat)
- Adjusted Operating Income: $19.09 million vs analyst estimates of $18.8 million (10.7% margin, 1.5% beat)
- Revenue Guidance for Q1 CY2025 is $178 million at the midpoint, below analyst estimates of $181.7 million
- Operating Margin: 5%, up from -5.2% in the same quarter last year
- Free Cash Flow Margin: 13.5%, up from 4.6% in the previous quarter
- Billings: $173.1 million at quarter end, down 4.4% year on year
- Market Capitalization: $355.4 million
"Our third quarter results highlight further progress and continued momentum in our transformation journey. We delivered solid financial performance, with record cash flow from operations and strong adoption of our AI-powered customer experience solutions, driving a 60% year-over-year increase in new products. As we move forward, our focus remains on enhancing customer value, accelerating growth, and driving long-term profitability. With a clear strategy and a strong team, I believe we are well-positioned to capitalize on the opportunities ahead," said Samuel Wilson, Chief Executive Officer at 8x8, Inc.
Company Overview
Founded in 1987, 8x8 (NYSE: EGHT) provides software for organizations to efficiently communicate and collaborate with their customers, employees, and partners.
Video Conferencing
Work is becoming more distributed, both across geographies and devices. In order for businesses to keep functioning efficiently, they need to be able to communicate as well as they did when the teams were co-located, which drives the demand for integrated communication platforms.
Sales Growth
Reviewing a company’s long-term sales performance reveals insights into its quality. Any business can have short-term success, but a top-tier one grows for years. Unfortunately, 8x8’s 6.1% annualized revenue growth over the last three years was weak. This was below our standard for the software sector and is a poor baseline for our analysis.
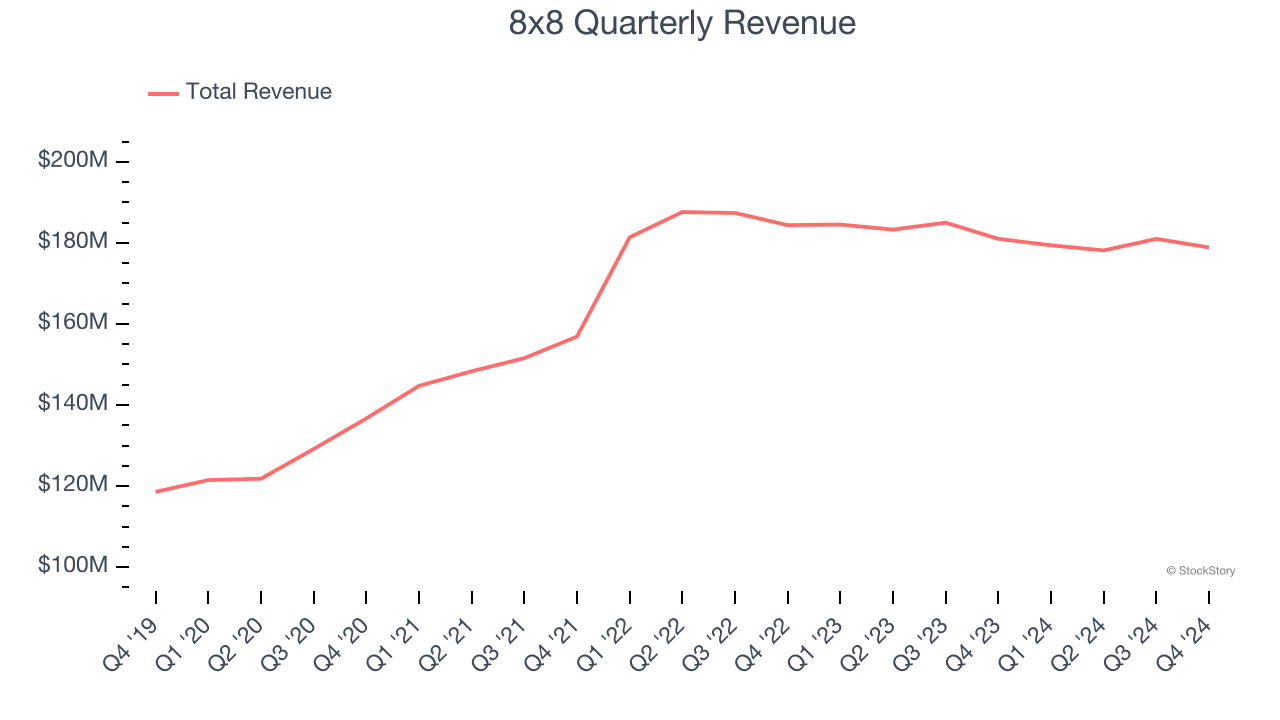
This quarter, 8x8 reported a rather uninspiring 1.2% year-on-year revenue decline to $178.9 million of revenue, in line with Wall Street’s estimates. Company management is currently guiding for flat sales next quarter.
Looking further ahead, sell-side analysts expect revenue to grow 1.4% over the next 12 months, a deceleration versus the last three years. This projection is underwhelming and suggests its products and services will see some demand headwinds.
Today’s young investors won’t have read the timeless lessons in Gorilla Game: Picking Winners In High Technology because it was written more than 20 years ago when Microsoft and Apple were first establishing their supremacy. But if we apply the same principles, then enterprise software stocks leveraging their own generative AI capabilities may well be the Gorillas of the future. So, in that spirit, we are excited to present our Special Free Report on a profitable, fast-growing enterprise software stock that is already riding the automation wave and looking to catch the generative AI next.
Billings
Billings is a non-GAAP metric that is often called “cash revenue” because it shows how much money the company has collected from customers in a certain period. This is different from revenue, which must be recognized in pieces over the length of a contract.
8x8’s billings came in at $173.1 million in Q4, and it averaged 2.5% year-on-year declines over the last four quarters. This performance mirrored its total sales and shows the company faced challenges in acquiring and retaining customers. It also suggests there may be increasing competition or market saturation. 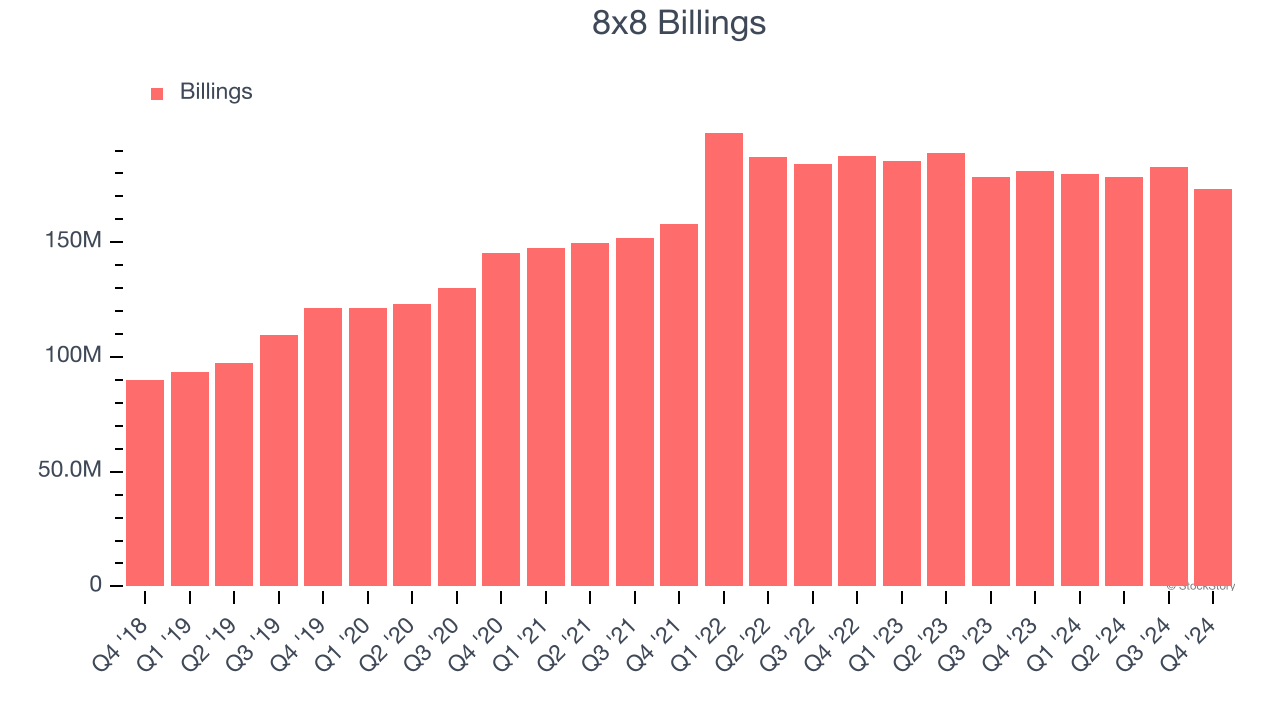
Customer Acquisition Efficiency
The customer acquisition cost (CAC) payback period measures the months a company needs to recoup the money spent on acquiring a new customer. This metric helps assess how quickly a business can break even on its sales and marketing investments.
8x8’s recent customer acquisition efforts haven’t yielded returns as its CAC payback period was negative this quarter, meaning its sales and marketing investments outpaced its revenue. The company’s inefficiency indicates it operates in a highly competitive environment where there is little differentiation between 8x8’s products and its peers.
Key Takeaways from 8x8’s Q4 Results
It was encouraging to see 8x8 beat analysts’ EBITDA expectations this quarter. On the other hand, its revenue guidance for next quarter missed significantly and its billings fell short of Wall Street’s estimates. Overall, this quarter could have been better. The stock traded down 3.8% to $2.75 immediately following the results.
8x8 may have had a tough quarter, but does that actually create an opportunity to invest right now? If you’re making that decision, you should consider the bigger picture of valuation, business qualities, as well as the latest earnings. We cover that in our actionable full research report which you can read here, it’s free.