
Cybersecurity software maker Tenable (NASDAQ: TENB) reported revenue ahead of Wall Street’s expectations in Q4 CY2024, with sales up 10.5% year on year to $235.7 million. On the other hand, next quarter’s revenue guidance of $233 million was less impressive, coming in 1.1% below analysts’ estimates. Its non-GAAP profit of $0.41 per share was 19% above analysts’ consensus estimates.
Is now the time to buy Tenable? Find out by accessing our full research report, it’s free.
Tenable (TENB) Q4 CY2024 Highlights:
- Revenue: $235.7 million vs analyst estimates of $231.6 million (10.5% year-on-year growth, 1.8% beat)
- Adjusted EPS: $0.41 vs analyst estimates of $0.34 ($0.07 beat)
- Adjusted Operating Income: $59.35 million vs analyst estimates of $48.22 million (25.2% margin, 23.1% beat)
- Management’s revenue guidance for the upcoming financial year 2025 is $976 million at the midpoint, missing analyst estimates by 0.7% and implying 8.4% growth (vs 12.7% in FY2024)
- Adjusted EPS guidance for the upcoming financial year 2025 is $1.56 at the midpoint, beating analyst estimates by 7.2%
- Operating Margin: 5.5%, up from -6.7% in the same quarter last year
- Free Cash Flow Margin: 33.2%, up from 23.2% in the previous quarter
- Billings: $302.2 million at quarter end, up 7% year on year
- Market Capitalization: $5.17 billion
“We are very pleased with the results for the quarter as we delivered better-than-expected CCB, revenue, operating income, EPS and unlevered free cash flow,” said Steve Vintz, Co-CEO and CFO of Tenable.
Company Overview
Founded in 2002 by three cybersecurity veterans, Tenable (NASDAQ: TENB) provides software as a service that helps companies understand where they are exposed to cyber security risk and how to reduce it.
Vulnerability Management
The demand for cybersecurity is growing as more and more businesses are moving their data and processes into the cloud, which along with a major increase in employees working remotely, has increased their exposure to attacks and malware. Additionally, the growing array of corporate IT systems, applications and internet connected devices has increased the complexity of network security, all of which has substantially increased the demand for software meant to protect data breaches.
Sales Growth
A company’s long-term sales performance signals its overall quality. Even a bad business can shine for one or two quarters, but a top-tier one grows for years. Over the last three years, Tenable grew its sales at a 18.5% annual rate. Although this growth is acceptable on an absolute basis, it fell slightly short of our benchmark for the software sector, which enjoys a number of secular tailwinds.
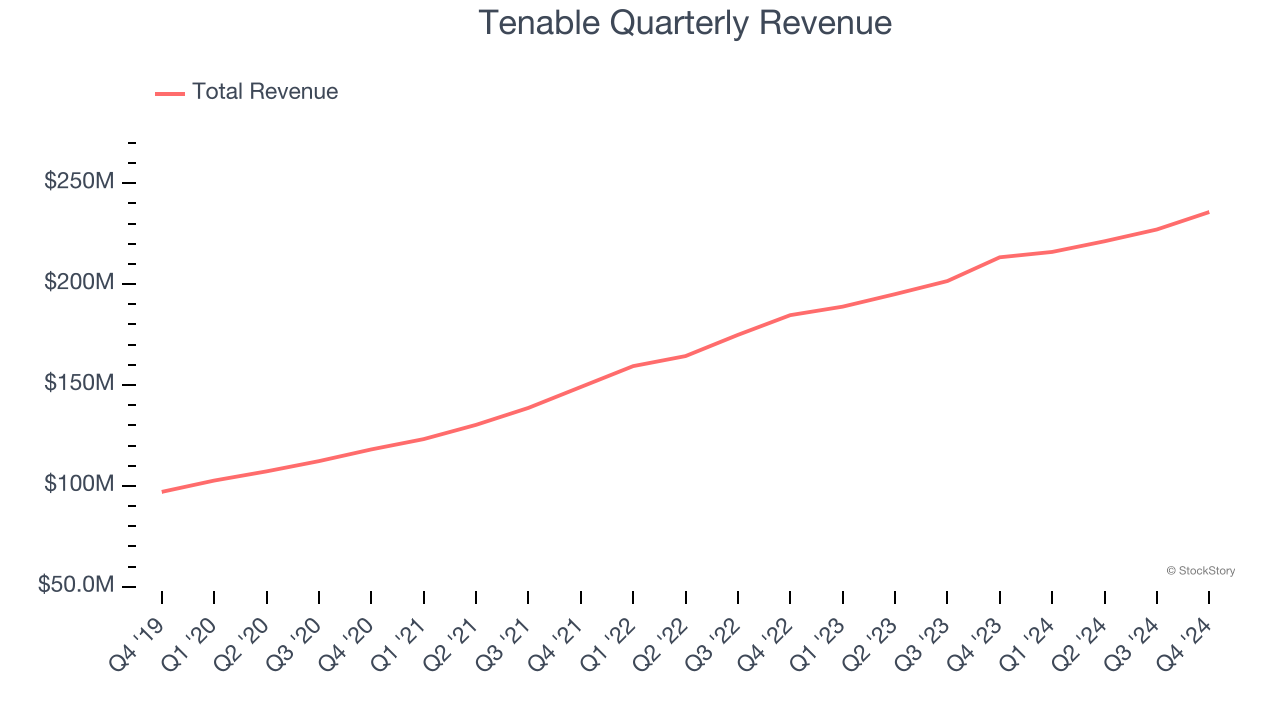
This quarter, Tenable reported year-on-year revenue growth of 10.5%, and its $235.7 million of revenue exceeded Wall Street’s estimates by 1.8%. Company management is currently guiding for a 7.9% year-on-year increase in sales next quarter.
Looking further ahead, sell-side analysts expect revenue to grow 8.8% over the next 12 months, a deceleration versus the last three years. This projection is underwhelming and indicates its products and services will see some demand headwinds.
Software is eating the world and there is virtually no industry left that has been untouched by it. That drives increasing demand for tools helping software developers do their jobs, whether it be monitoring critical cloud infrastructure, integrating audio and video functionality, or ensuring smooth content streaming. Click here to access a free report on our 3 favorite stocks to play this generational megatrend.
Billings
Billings is a non-GAAP metric that is often called “cash revenue” because it shows how much money the company has collected from customers in a certain period. This is different from revenue, which must be recognized in pieces over the length of a contract.
Tenable’s billings came in at $302.2 million in Q4, and over the last four quarters, its growth slightly lagged the sector as it averaged 9.4% year-on-year increases. This alternate topline metric grew slower than total sales, meaning the company recognizes revenue faster than it collects cash - a headwind for its liquidity that could also signal a slowdown in future revenue growth. 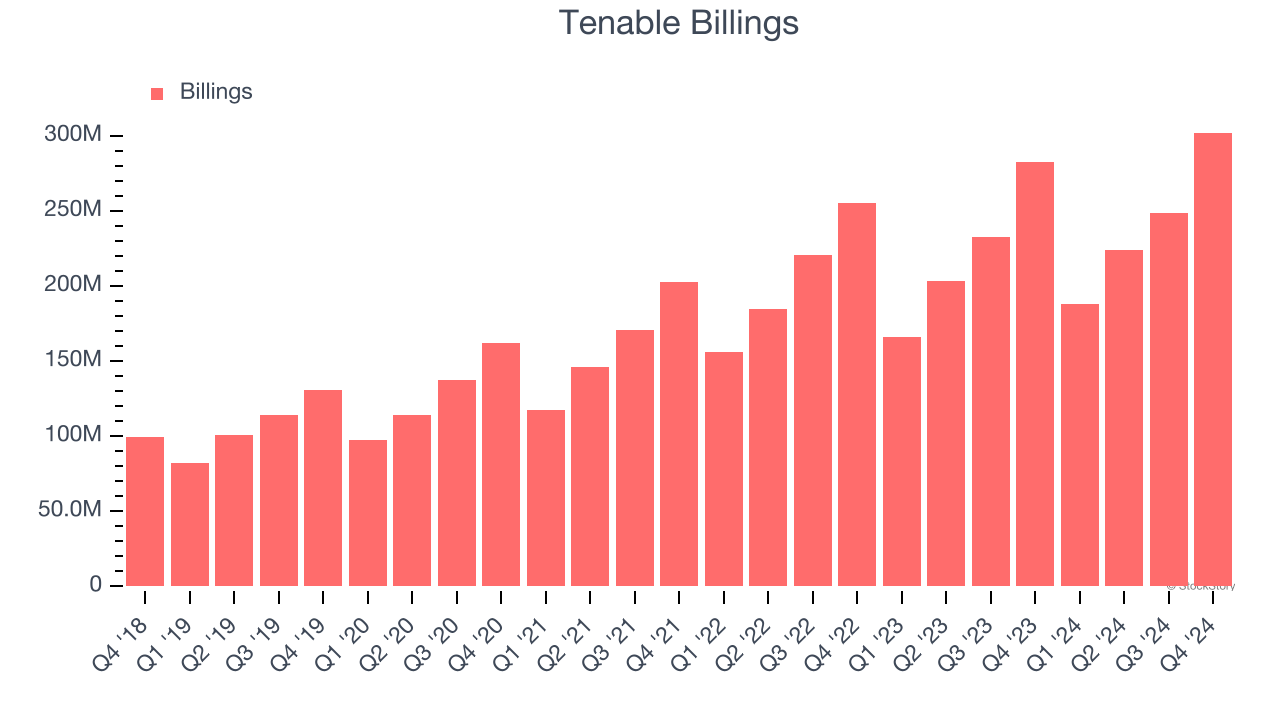
Customer Acquisition Efficiency
The customer acquisition cost (CAC) payback period measures the months a company needs to recoup the money spent on acquiring a new customer. This metric helps assess how quickly a business can break even on its sales and marketing investments.
It’s relatively expensive for Tenable to acquire new customers as its CAC payback period checked in at 83.7 months this quarter. The company’s slow recovery of its sales and marketing expenses indicates it operates in a highly competitive market and must invest to stand out, even if the return on that investment is low. 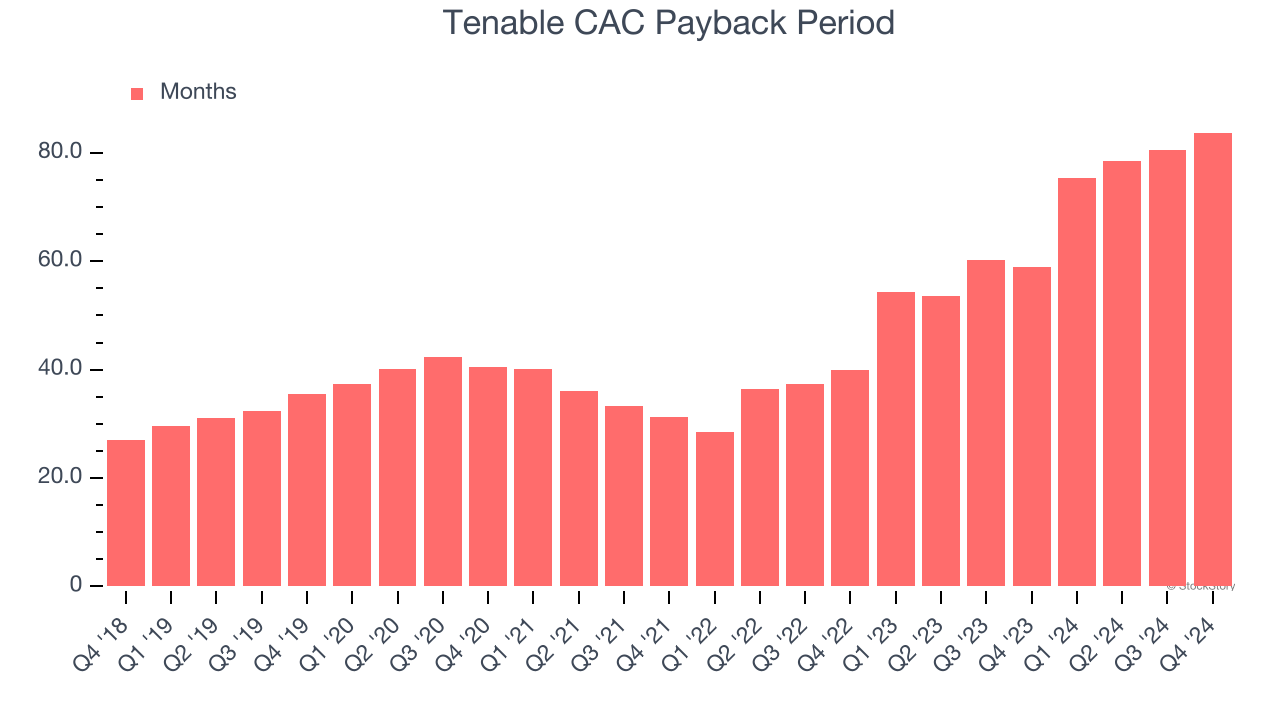
Key Takeaways from Tenable’s Q4 Results
We were impressed by Tenable’s optimistic full-year EPS guidance, which blew past analysts’ expectations. We were also happy its revenue outperformed Wall Street’s estimates. On the other hand, its revenue guidance for next quarter slightly missed and its EPS guidance for next quarter fell short of Wall Street’s estimates. Overall, this was a softer quarter. The stock traded down 1.8% to $42.45 immediately following the results.
Tenable may have had a tough quarter, but does that actually create an opportunity to invest right now? We think that the latest quarter is only one piece of the longer-term business quality puzzle. Quality, when combined with valuation, can help determine if the stock is a buy. We cover that in our actionable full research report which you can read here, it’s free.


