Semiconductor manufacturer Vishay Intertechnology (NYSE: VSH) fell short of the market’s revenue expectations in Q4 CY2024, with sales falling 9% year on year to $714.7 million. Next quarter’s revenue guidance of $710 million underwhelmed, coming in 2.3% below analysts’ estimates. Its non-GAAP loss of $0 per share was significantly below analysts’ consensus estimates.
Is now the time to buy Vishay Intertechnology? Find out by accessing our full research report, it’s free.
Vishay Intertechnology (VSH) Q4 CY2024 Highlights:
- Revenue: $714.7 million vs analyst estimates of $722.3 million (9% year-on-year decline, 1.1% miss)
- Adjusted EPS: $0 vs analyst estimates of $0.08 (significant miss)
- Adjusted EBITDA: $66.21 million vs analyst estimates of $69.28 million (9.3% margin, 4.4% miss)
- Revenue Guidance for Q1 CY2025 is $710 million at the midpoint, below analyst estimates of $726.7 million
- Operating Margin: -7.9%, down from 9.9% in the same quarter last year
- Free Cash Flow was -$75.63 million compared to -$138.9 million in the same quarter last year
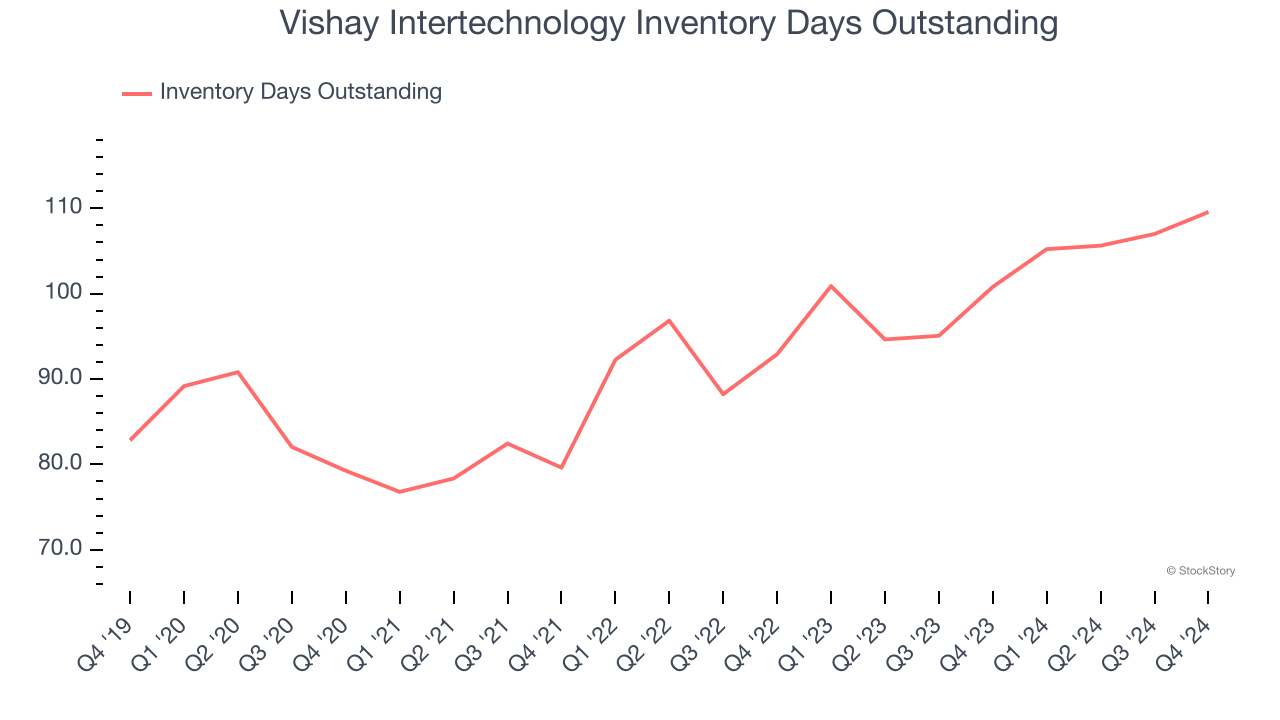
- Inventory Days Outstanding: 110, up from 107 in the previous quarter
- Market Capitalization: $2.26 billion
“Our fourth quarter results came in as expected, slightly below the third quarter. Nevertheless, we saw many promising indicators including a positive book-to-bill for the first time in nine quarters, strong order intake for smart grid infrastructure projects, and initial shipments for A.I. servers,” said Joel Smejkal, President and CEO.
Company Overview
Named after the founder's ancestral village in present-day Lithuania, Vishay Intertechnology (NYSE: VSH) manufactures simple chips and electronic components that are building blocks of virtually all types of electronic devices.
Analog Semiconductors
Demand for analog chips is generally linked to the overall level of economic growth, as analog chips serve as the building blocks of most electronic goods and equipment. Unlike digital chip designers, analog chip makers tend to produce the majority of their own chips, as analog chip production does not require expensive leading edge nodes. Less dependent on major secular growth drivers, analog product cycles are much longer, often 5-7 years.
Sales Growth
Examining a company’s long-term performance can provide clues about its quality. Any business can put up a good quarter or two, but the best consistently grow over the long haul. Regrettably, Vishay Intertechnology’s sales grew at a sluggish 1.9% compounded annual growth rate over the last five years. This was below our standards and is a poor baseline for our analysis. Semiconductors are a cyclical industry, and long-term investors should be prepared for periods of high growth followed by periods of revenue contractions.
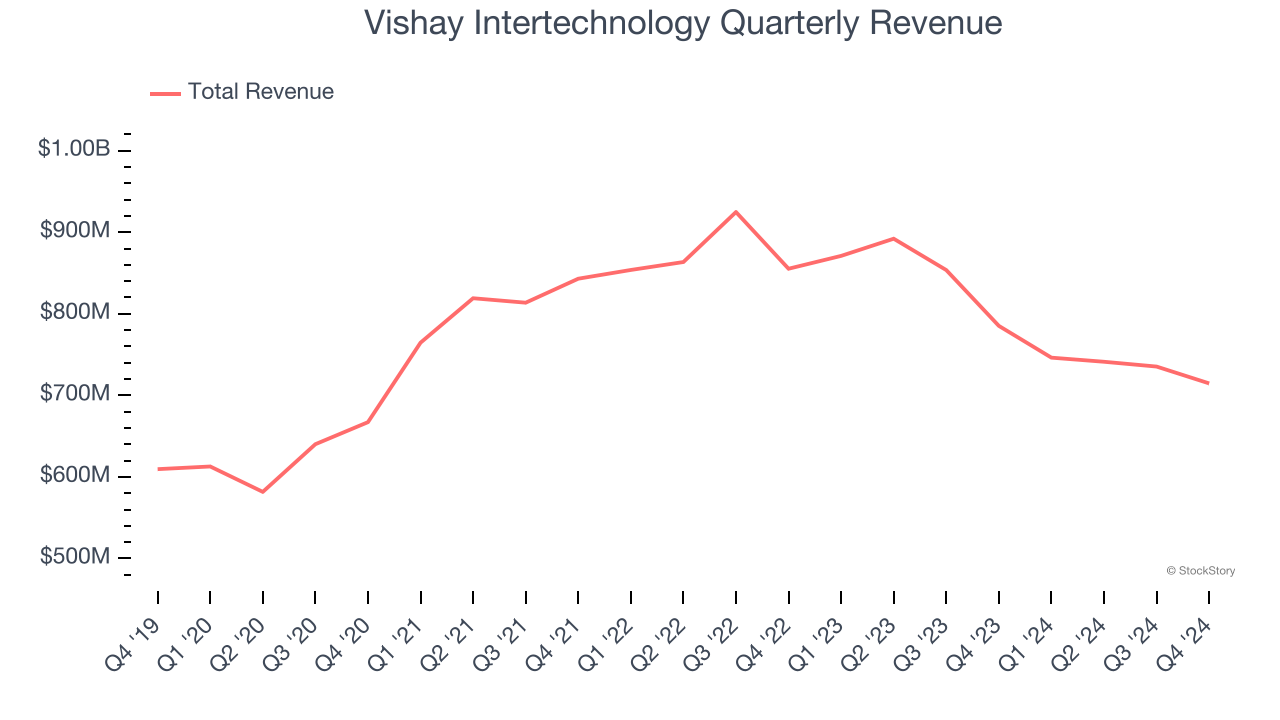
We at StockStory place the most emphasis on long-term growth, but within semiconductors, a half-decade historical view may miss new demand cycles or industry trends like AI. Vishay Intertechnology’s history shows it grew in the past but relinquished its gains over the last two years, as its revenue fell by 8.4% annually. 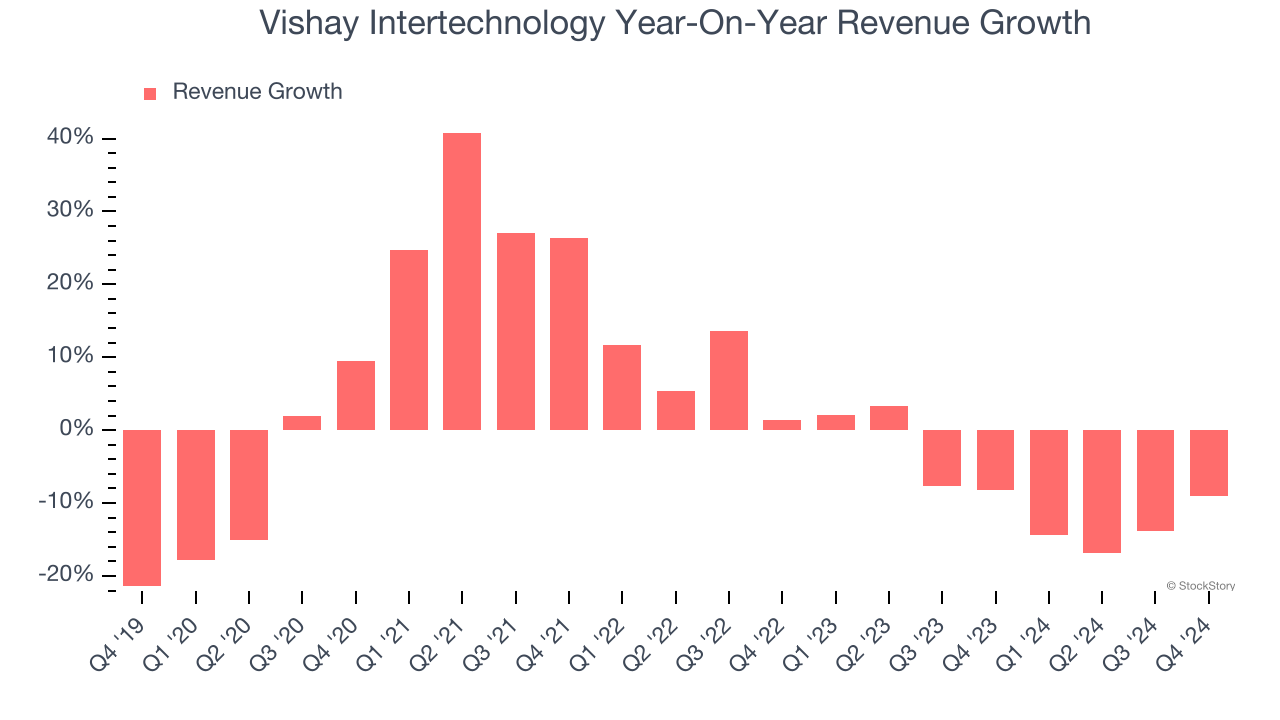
This quarter, Vishay Intertechnology missed Wall Street’s estimates and reported a rather uninspiring 9% year-on-year revenue decline, generating $714.7 million of revenue. Company management is currently guiding for a 4.9% year-on-year decline in sales next quarter.
Looking further ahead, sell-side analysts expect revenue to grow 4.3% over the next 12 months. While this projection implies its newer products and services will spur better top-line performance, it is still below the sector average.
Unless you’ve been living under a rock, it should be obvious by now that generative AI is going to have a huge impact on how large corporations do business. While Nvidia and AMD are trading close to all-time highs, we prefer a lesser-known (but still profitable) stock benefiting from the rise of AI. Click here to access our free report one of our favorites growth stories.
Product Demand & Outstanding Inventory
Days Inventory Outstanding (DIO) is an important metric for chipmakers, as it reflects a business’ capital intensity and the cyclical nature of semiconductor supply and demand. In a tight supply environment, inventories tend to be stable, allowing chipmakers to exert pricing power. Steadily increasing DIO can be a warning sign that demand is weak, and if inventories continue to rise, the company may have to downsize production.
This quarter, Vishay Intertechnology’s DIO came in at 110, which is 17 days above its five-year average, suggesting that the company’s inventory has grown to higher levels than we’ve seen in the past.
Key Takeaways from Vishay Intertechnology’s Q4 Results
We struggled to find many positives in these results. Its revenue guidance for next quarter missed significantly and its revenue, EPS, and EBITDA fell short of Wall Street’s estimates. Overall, this was a softer quarter. The stock traded down 1.9% to $16.30 immediately following the results.
Vishay Intertechnology’s latest earnings report disappointed. One quarter doesn’t define a company’s quality, so let’s explore whether the stock is a buy at the current price. What happened in the latest quarter matters, but not as much as longer-term business quality and valuation, when deciding whether to invest in this stock. We cover that in our actionable full research report which you can read here, it’s free.