
Clinical research company IQVIA (NYSE: IQV) beat Wall Street’s revenue expectations in Q4 CY2024, with sales up 2.3% year on year to $3.96 billion. On the other hand, the company’s full-year revenue guidance of $15.93 billion at the midpoint came in 0.6% below analysts’ estimates. Its non-GAAP profit of $3.12 per share was in line with analysts’ consensus estimates.
Is now the time to buy IQVIA? Find out by accessing our full research report, it’s free.
IQVIA (IQV) Q4 CY2024 Highlights:
- Revenue: $3.96 billion vs analyst estimates of $3.93 billion (2.3% year-on-year growth, 0.6% beat)
- Adjusted EPS: $3.12 vs analyst expectations of $3.11 (in line)
- Adjusted EBITDA: $996 million vs analyst estimates of $996.3 million (25.2% margin, in line)
- Management’s revenue guidance for the upcoming financial year 2025 is $15.93 billion at the midpoint, missing analyst estimates by 0.6% and implying 3.4% growth (vs 2.8% in FY2024)
- Adjusted EPS guidance for the upcoming financial year 2025 is $11.90 at the midpoint, in line with analyst estimates
- EBITDA guidance for the upcoming financial year 2025 is $3.83 billion at the midpoint, in line with analyst expectations
- Operating Margin: 15.8%, up from 13% in the same quarter last year
- Free Cash Flow Margin: 18.2%, up from 14.7% in the same quarter last year
- Constant Currency Revenue rose 3% year on year, in line with the same quarter last year
- Market Capitalization: $37.29 billion
"IQVIA delivered excellent fourth quarter performance, closing out a strong 2024," said Ari Bousbib, chairman and CEO of IQVIA.
Company Overview
Formed in 2016 through the merger of IMS Health and Quintiles, offers advanced analytics, technology solutions, and clinical research services to life sciences companies, helping them accelerate drug development and optimize healthcare operations.
Drug Development Inputs & Services
Companies specializing in drug development inputs and services play a crucial role in the pharmaceutical and biotechnology value chain. Essential support for drug discovery, preclinical testing, and manufacturing means stable demand, as pharmaceutical companies often outsource non-core functions with medium to long-term contracts. However, the business model faces high capital requirements, customer concentration, and vulnerability to shifts in biopharma R&D budgets or regulatory frameworks. Looking ahead, the industry will likely enjoy tailwinds such as increasing investment in biologics, cell and gene therapies, and advancements in precision medicine, which drive demand for sophisticated tools and services. There is a growing trend of outsourcing in drug development for nimbleness and cost efficiency, which benefits the industry. On the flip side, potential headwinds include pricing pressures as efforts to contain healthcare costs are always top of mind. An evolving regulatory backdrop could also slow innovation or client activity.
Sales Growth
A company’s long-term performance is an indicator of its overall quality. While any business can experience short-term success, top-performing ones enjoy sustained growth for years. Unfortunately, IQVIA’s 6.8% annualized revenue growth over the last five years was mediocre. This fell short of our benchmark for the healthcare sector and is a rough starting point for our analysis.
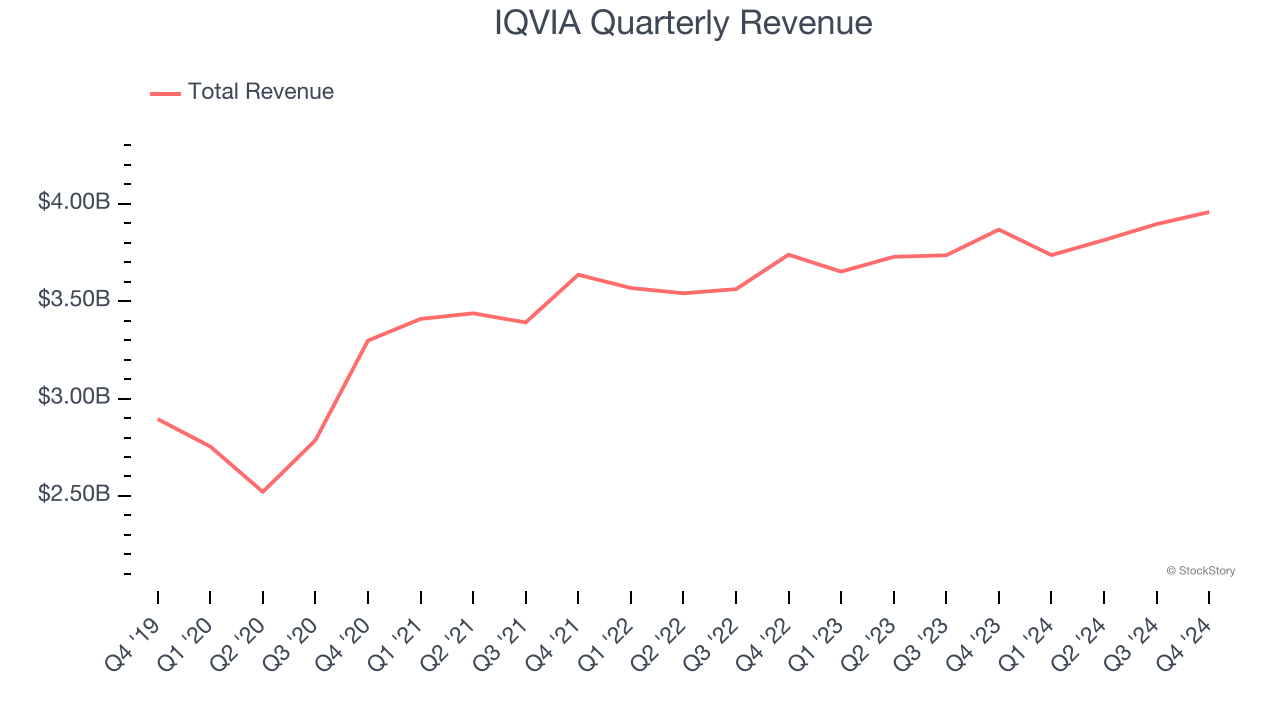
Long-term growth is the most important, but within healthcare, a half-decade historical view may miss new innovations or demand cycles. IQVIA’s recent history shows its demand slowed as its annualized revenue growth of 3.4% over the last two years is below its five-year trend. 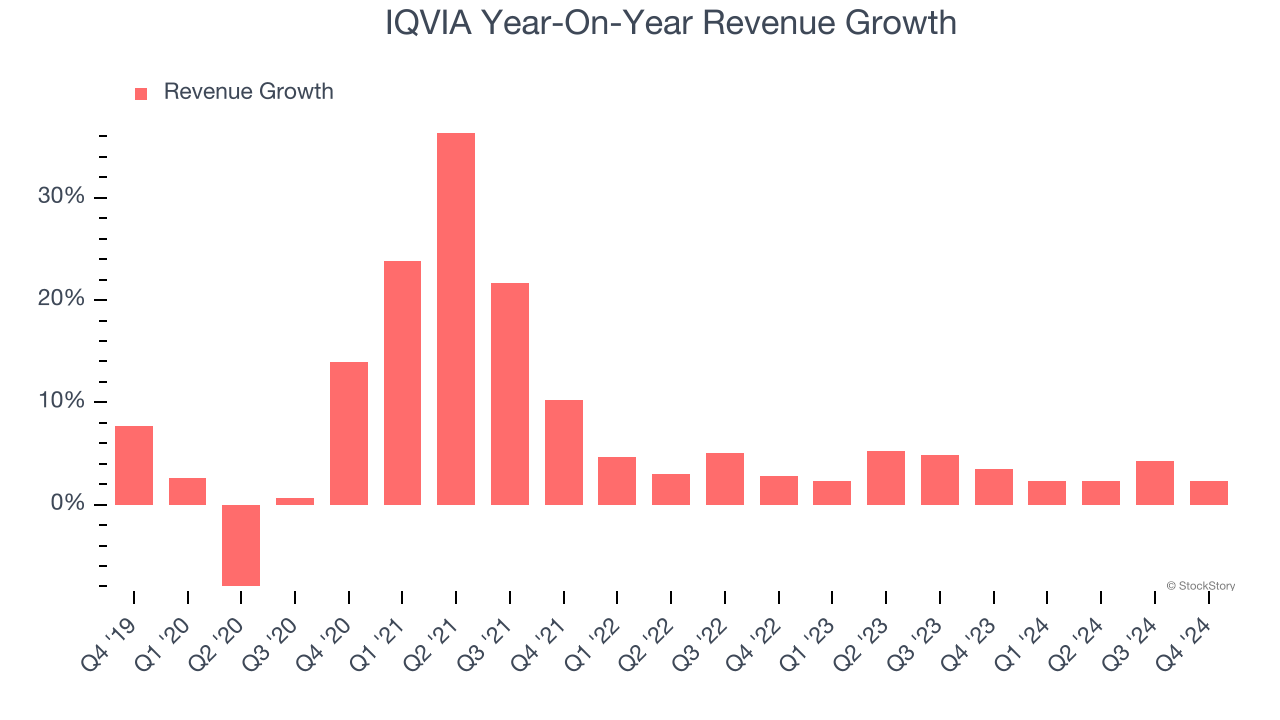
We can better understand the company’s sales dynamics by analyzing its constant currency revenue, which excludes currency movements that are outside their control and not indicative of demand. Over the last two years, its constant currency sales averaged 3.8% year-on-year growth. Because this number aligns with its normal revenue growth, we can see IQVIA’s foreign exchange rates have been steady. 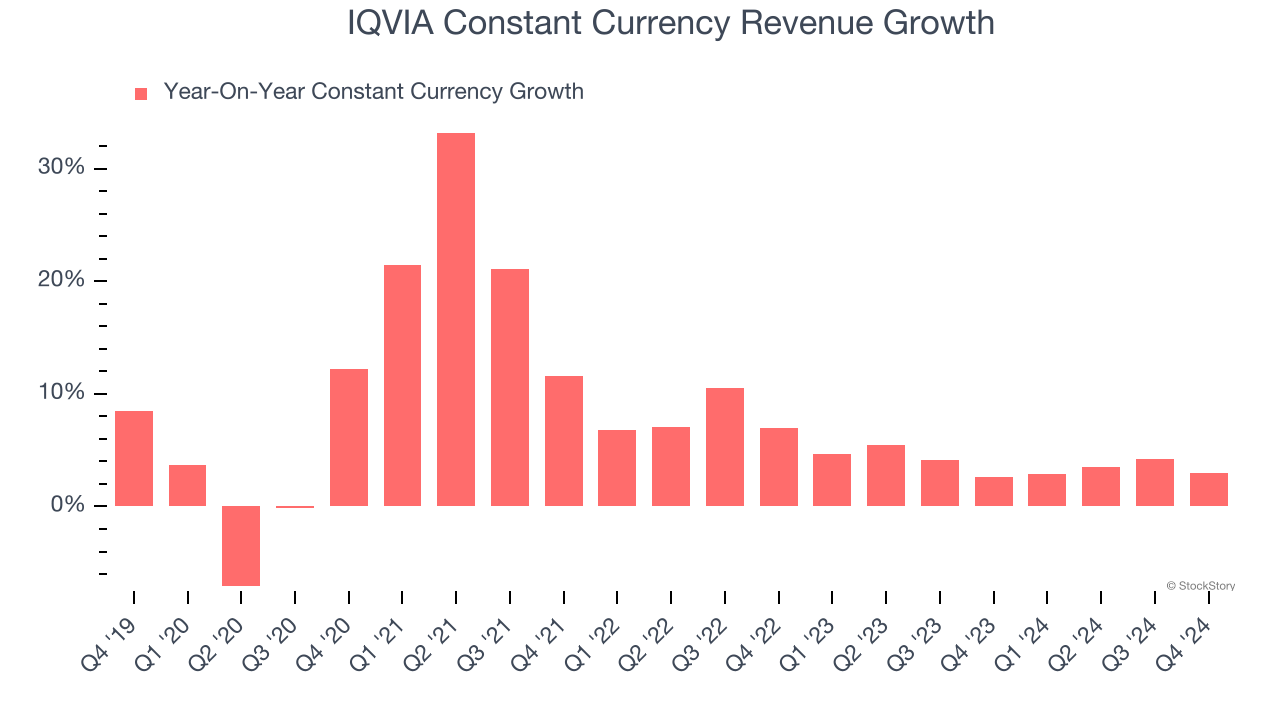
This quarter, IQVIA reported modest year-on-year revenue growth of 2.3% but beat Wall Street’s estimates by 0.6%.
Looking ahead, sell-side analysts expect revenue to grow 3.9% over the next 12 months, similar to its two-year rate. This projection is underwhelming and indicates its newer products and services will not accelerate its top-line performance yet.
Software is eating the world and there is virtually no industry left that has been untouched by it. That drives increasing demand for tools helping software developers do their jobs, whether it be monitoring critical cloud infrastructure, integrating audio and video functionality, or ensuring smooth content streaming. Click here to access a free report on our 3 favorite stocks to play this generational megatrend.
Adjusted Operating Margin
Adjusted operating margin is one of the best measures of profitability because it tells us how much money a company takes home after subtracting all core expenses, like marketing and R&D. It also removes various one-time costs to paint a better picture of normalized profits.
IQVIA has managed its cost base well over the last five years. It demonstrated solid profitability for a healthcare business, producing an average adjusted operating margin of 18.6%.
Analyzing the trend in its profitability, IQVIA’s adjusted operating margin rose by 2.3 percentage points over the last five years. The company’s two-year trajectory shows its performance was mostly driven by its recent improvements.
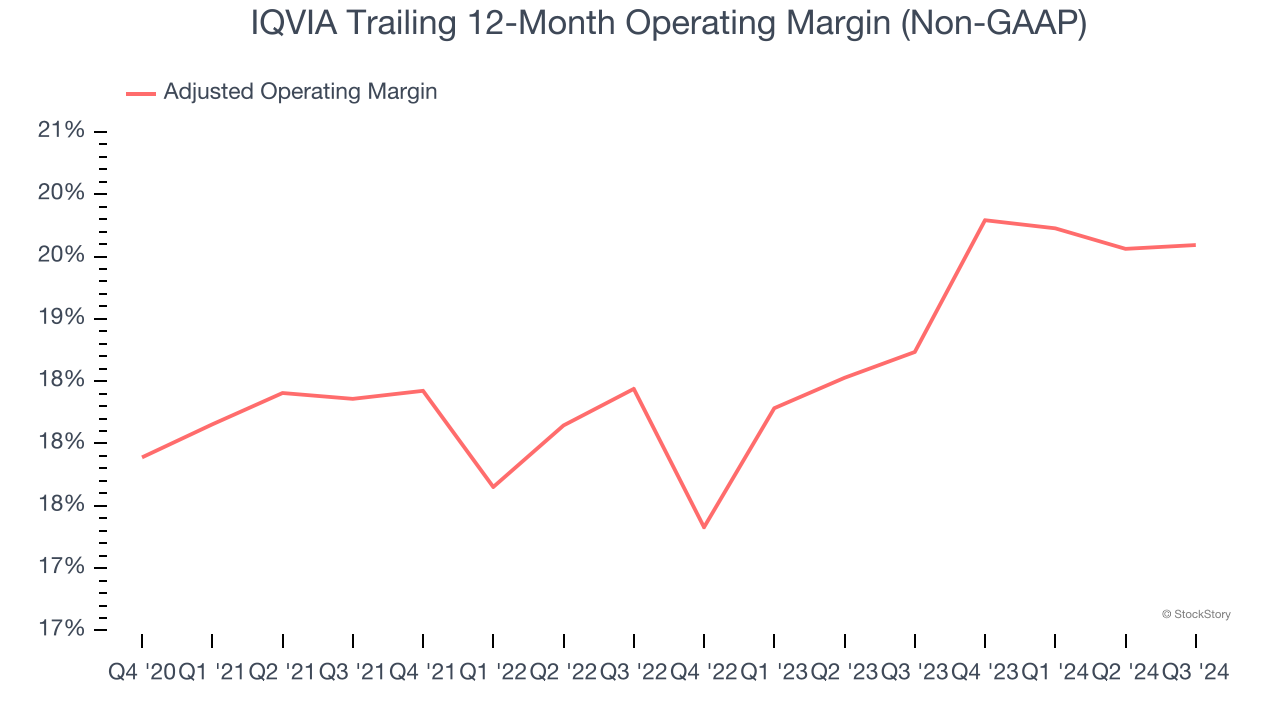
This quarter, IQVIA generated an adjusted operating profit margin of 25.2%, up 5.9 percentage points year on year. This increase was a welcome development and shows it was recently more efficient because its expenses grew slower than its revenue.
Earnings Per Share
We track the long-term change in earnings per share (EPS) for the same reason as long-term revenue growth. Compared to revenue, however, EPS highlights whether a company’s growth is profitable.
IQVIA’s EPS grew at a remarkable 11.7% compounded annual growth rate over the last five years, higher than its 6.8% annualized revenue growth. This tells us the company became more profitable on a per-share basis as it expanded.
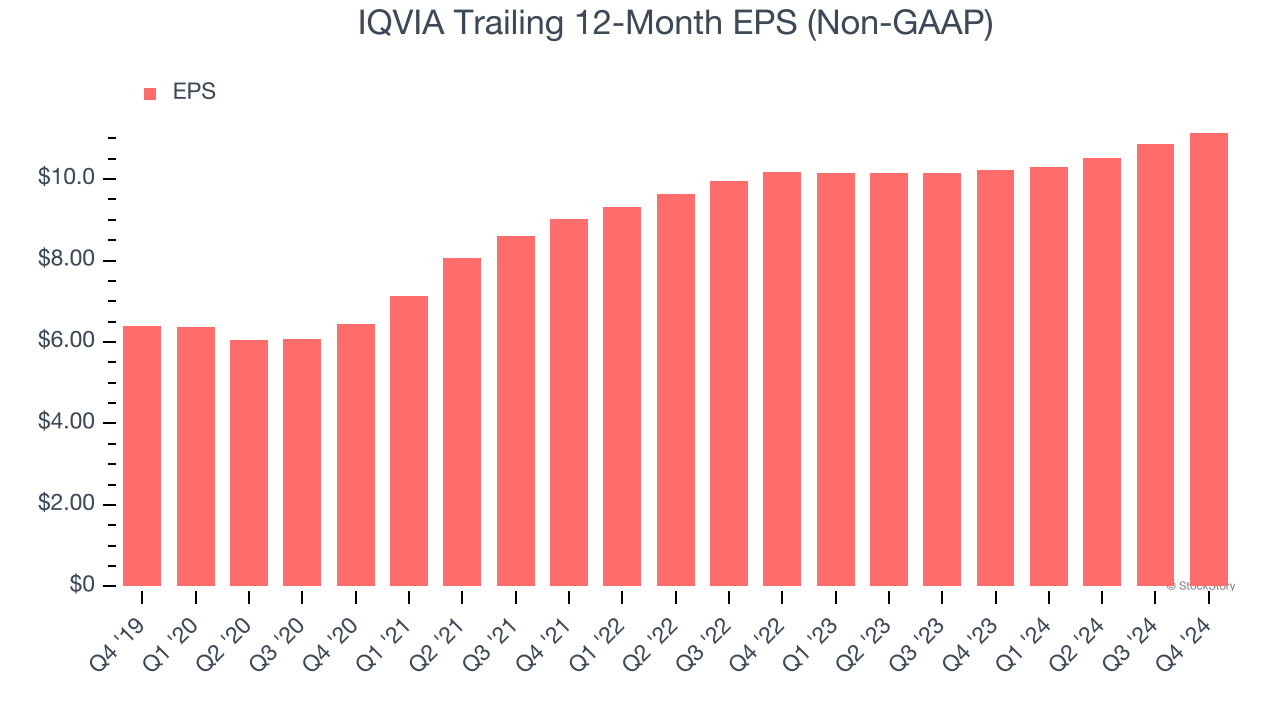
Diving into IQVIA’s quality of earnings can give us a better understanding of its performance. As we mentioned earlier, IQVIA’s adjusted operating margin expanded by 2.3 percentage points over the last five years. On top of that, its share count shrank by 8.2%. These are positive signs for shareholders because improving profitability and share buybacks turbocharge EPS growth relative to revenue growth. 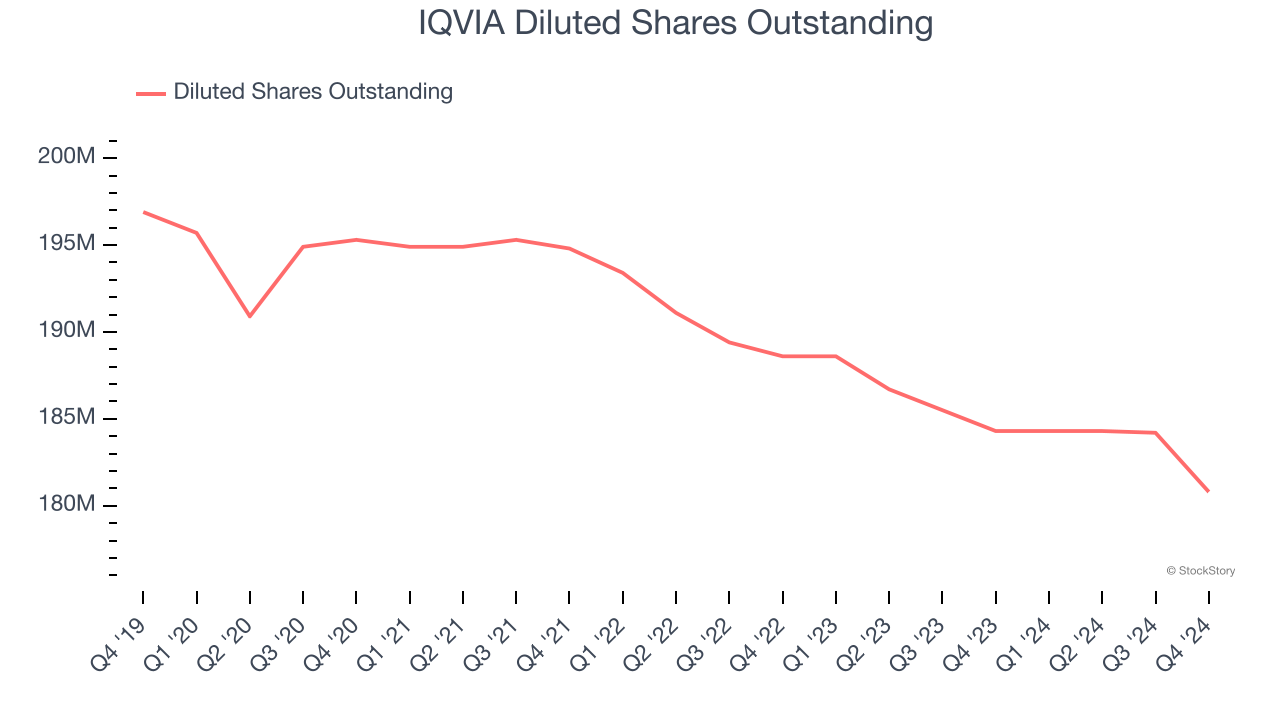
In Q4, IQVIA reported EPS at $3.12, up from $2.84 in the same quarter last year. This print was close to analysts’ estimates. Over the next 12 months, Wall Street expects IQVIA’s full-year EPS of $11.14 to grow 4.5%.
Key Takeaways from IQVIA’s Q4 Results
It was good to see IQVIA narrowly top analysts’ constant currency revenue expectations this quarter. We were also happy its revenue also narrowly outperformed Wall Street’s estimates. On the other hand, its EPS was in line and its full-year revenue guidance fell slightly short of Wall Street’s estimates. Overall, this was a mixed quarter. Still the stock traded up 5.2% to $216 immediately following the results.
So do we think IQVIA is an attractive buy at the current price? When making that decision, it’s important to consider its valuation, business qualities, as well as what has happened in the latest quarter. We cover that in our actionable full research report which you can read here, it’s free.