Luxury fashion conglomerate Tapestry (NYSE: TPR) announced better-than-expected revenue in Q4 CY2024, with sales up 5.3% year on year to $2.20 billion. The company’s full-year revenue guidance of $6.85 billion at the midpoint came in 1.4% above analysts’ estimates. Its GAAP profit of $1.38 per share was 12.7% below analysts’ consensus estimates.
Is now the time to buy Tapestry? Find out by accessing our full research report, it’s free.
Tapestry (TPR) Q4 CY2024 Highlights:
- Revenue: $2.20 billion vs analyst estimates of $2.11 billion (5.3% year-on-year growth, 4.2% beat)
- EPS (GAAP): $1.38 vs analyst expectations of $1.58 (12.7% miss largely due to one-time debt extinguishment charge)
- The company lifted its revenue guidance for the full year to $6.85 billion at the midpoint from $6.75 billion, a 1.5% increase
- EPS (GAAP) guidance for the full year is $4.88 at the midpoint, beating analyst estimates by 13%
- Operating Margin: 22.4%, in line with the same quarter last year
- Free Cash Flow Margin: 23%, down from 38.6% in the same quarter last year
- Constant Currency Revenue rose 5% year on year (3% in the same quarter last year)
- Market Capitalization: $16.82 billion
“Our strong second quarter outperformance is a testament to our exceptional teams and our collective commitment to disciplined brand building,” said Joanne Crevoiserat, Chief Executive Officer of Tapestry,
Company Overview
Originally founded as Coach, Tapestry (NYSE: TPR) is an American fashion conglomerate with a portfolio of luxury brands offering high-quality accessories and fashion products.
Apparel and Accessories
Thanks to social media and the internet, not only are styles changing more frequently today than in decades past but also consumers are shifting the way they buy their goods, favoring omnichannel and e-commerce experiences. Some apparel and accessories companies have made concerted efforts to adapt while those who are slower to move may fall behind.
Sales Growth
A company’s long-term sales performance signals its overall quality. Even a bad business can shine for one or two quarters, but a top-tier one grows for years. Regrettably, Tapestry’s sales grew at a weak 2.4% compounded annual growth rate over the last five years. This fell short of our benchmarks and is a rough starting point for our analysis.
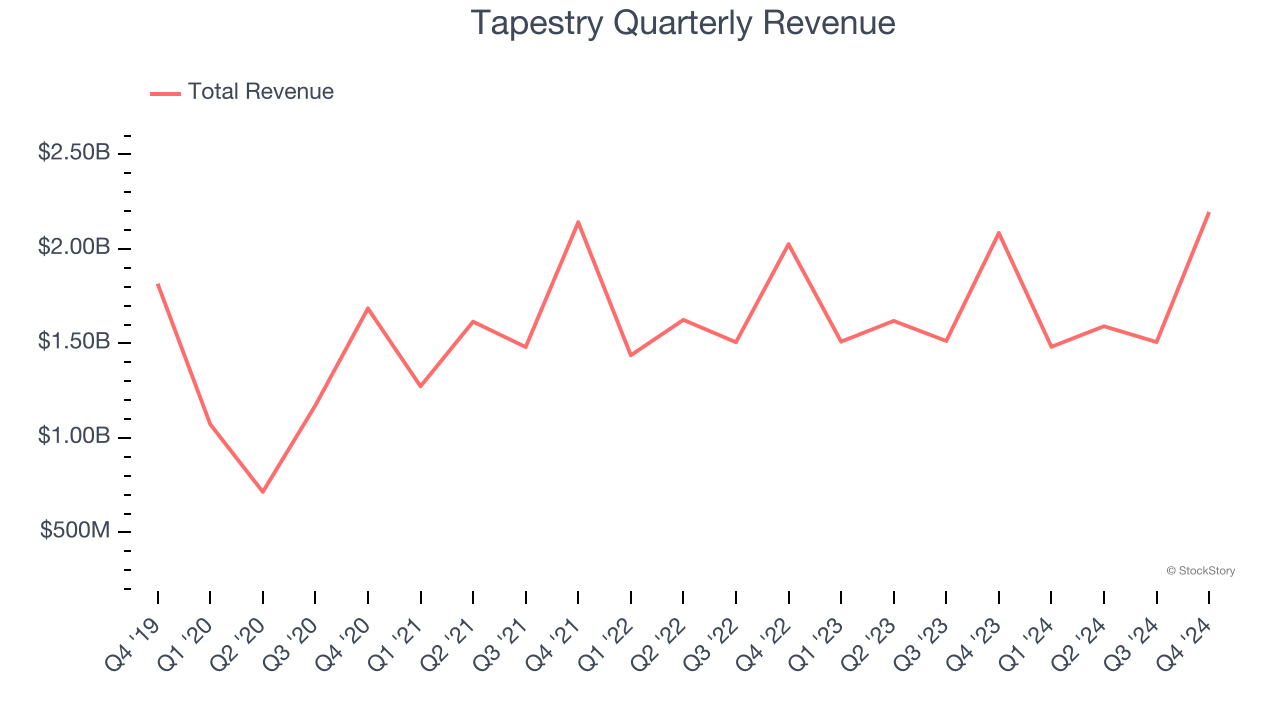
We at StockStory place the most emphasis on long-term growth, but within consumer discretionary, a stretched historical view may miss a company riding a successful new product or trend. Tapestry’s recent history shows its demand slowed as its annualized revenue growth of 1.4% over the last two years is below its five-year trend. 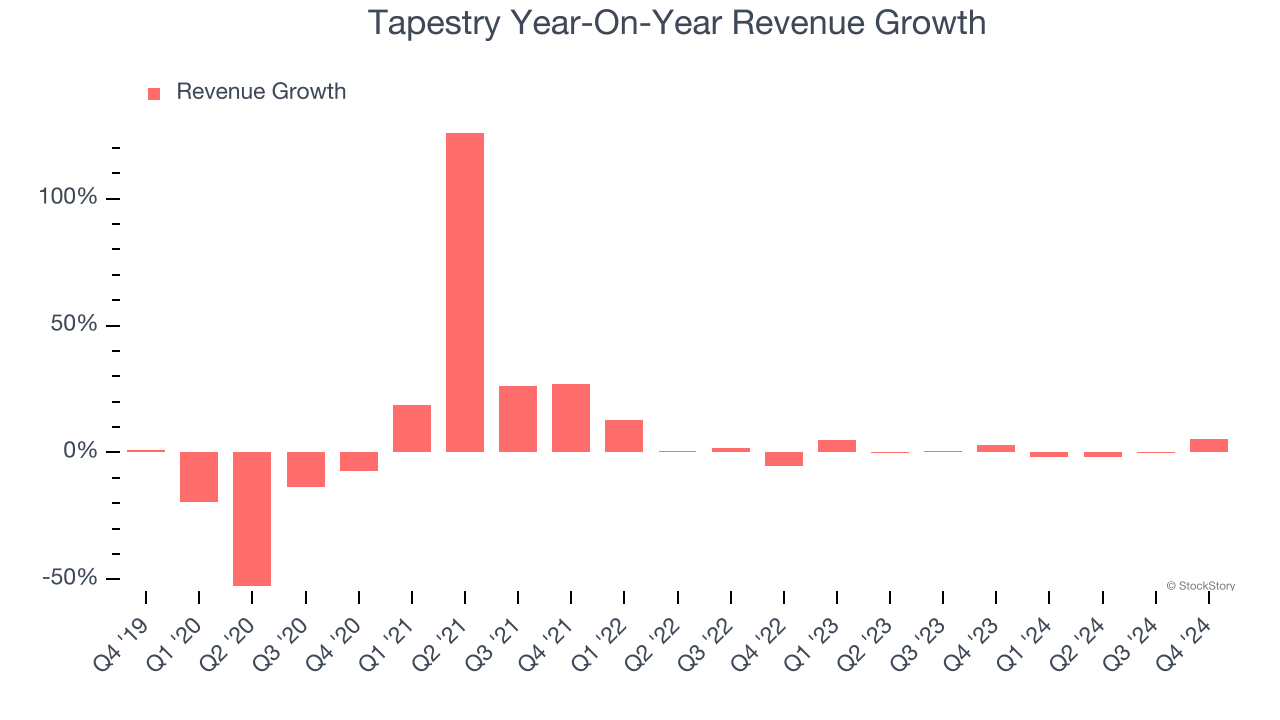
We can dig further into the company’s sales dynamics by analyzing its constant currency revenue, which excludes currency movements that are outside their control and not indicative of demand. Over the last two years, its constant currency sales averaged 2.5% year-on-year growth. Because this number aligns with its normal revenue growth, we can see Tapestry’s foreign exchange rates have been steady. 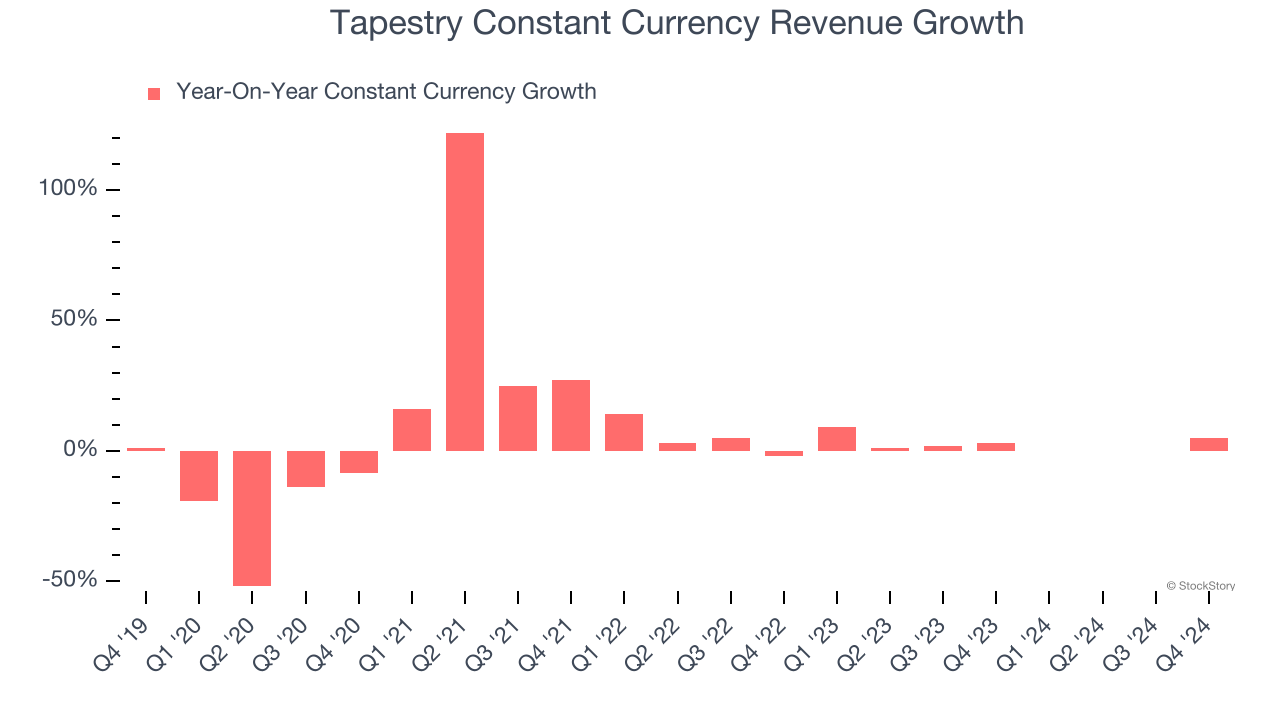
This quarter, Tapestry reported year-on-year revenue growth of 5.3%, and its $2.20 billion of revenue exceeded Wall Street’s estimates by 4.2%.
Looking ahead, sell-side analysts expect revenue to grow 1.2% over the next 12 months, similar to its two-year rate. This projection is underwhelming and indicates its newer products and services will not lead to better top-line performance yet.
Unless you’ve been living under a rock, it should be obvious by now that generative AI is going to have a huge impact on how large corporations do business. While Nvidia and AMD are trading close to all-time highs, we prefer a lesser-known (but still profitable) stock benefiting from the rise of AI. Click here to access our free report one of our favorites growth stories.
Cash Is King
Although earnings are undoubtedly valuable for assessing company performance, we believe cash is king because you can’t use accounting profits to pay the bills.
Tapestry has shown robust cash profitability, giving it an edge over its competitors and the ability to reinvest or return capital to investors. The company’s free cash flow margin averaged 16.2% over the last two years, quite impressive for a consumer discretionary business.
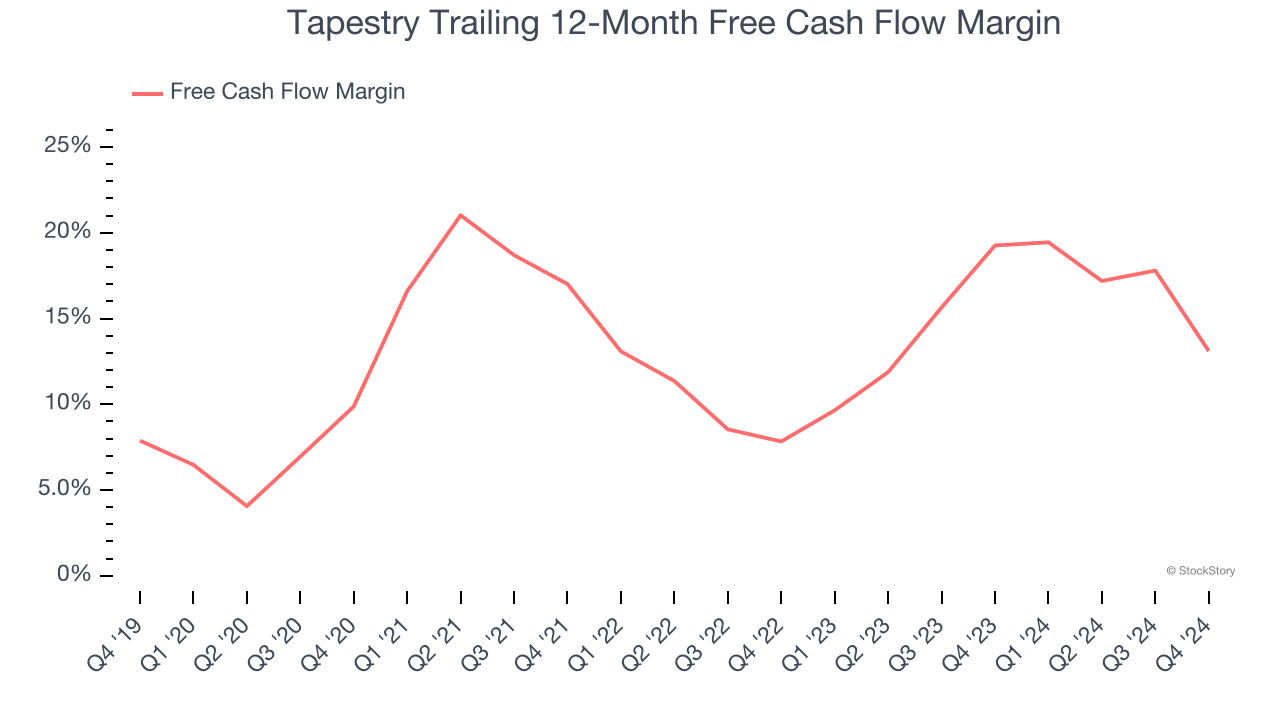
Tapestry’s free cash flow clocked in at $506 million in Q4, equivalent to a 23% margin. The company’s cash profitability regressed as it was 15.5 percentage points lower than in the same quarter last year, but it’s still above its two-year average. We wouldn’t read too much into this quarter’s decline because investment needs can be seasonal, leading to short-term swings. Long-term trends carry greater meaning.
Key Takeaways from Tapestry’s Q4 Results
This was the first earnings report after the company's $8.5 billion acquisition of Capri Holdings was called off due to antitrust concerns, and it was a beat and raise. We were impressed by how significantly Tapestry blew past analysts’ constant currency revenue expectations this quarter. We were also glad its full-year revenue guidance was lifted and full-year EPS guidance came in much higher than Wall Street’s estimates. You may have noticed that EPS missed, but this was largely due to a one-time debt extinguishment charge rather than something fundamental. Overall, this quarter was very good. The stock traded up 14.6% to $84.01 immediately following the results.
Tapestry had an encouraging quarter, but one earnings result doesn’t necessarily make the stock a buy. Let’s see if this is a good investment. The latest quarter does matter, but not nearly as much as longer-term fundamentals and valuation, when deciding if the stock is a buy. We cover that in our actionable full research report which you can read here, it’s free.