
HEICO has been treading water for the past six months, recording a small return of 3% while holding steady at $233.80. The stock also fell short of the S&P 500’s 16.9% gain during that period.
Given the weaker price action, is now a good time to buy HEI? Or should investors expect a bumpy road ahead? Find out in our full research report, it’s free.
Why Are We Positive On HEICO?
Founded in 1957, HEICO (NYSE: HEI) manufactures and services aerospace and electronic components for commercial aviation, defense, space, and other industries.
1. Organic Growth Indicates Solid Core Business
In addition to reported revenue, organic revenue is a useful data point for analyzing Aerospace companies. This metric gives visibility into HEICO’s core business because it excludes one-time events such as mergers, acquisitions, and divestitures along with foreign currency fluctuations - non-fundamental factors that can manipulate the income statement.
Over the last two years, HEICO’s organic revenue averaged 9.8% year-on-year growth. This performance was solid and shows it can expand steadily without relying on expensive (and risky) acquisitions. 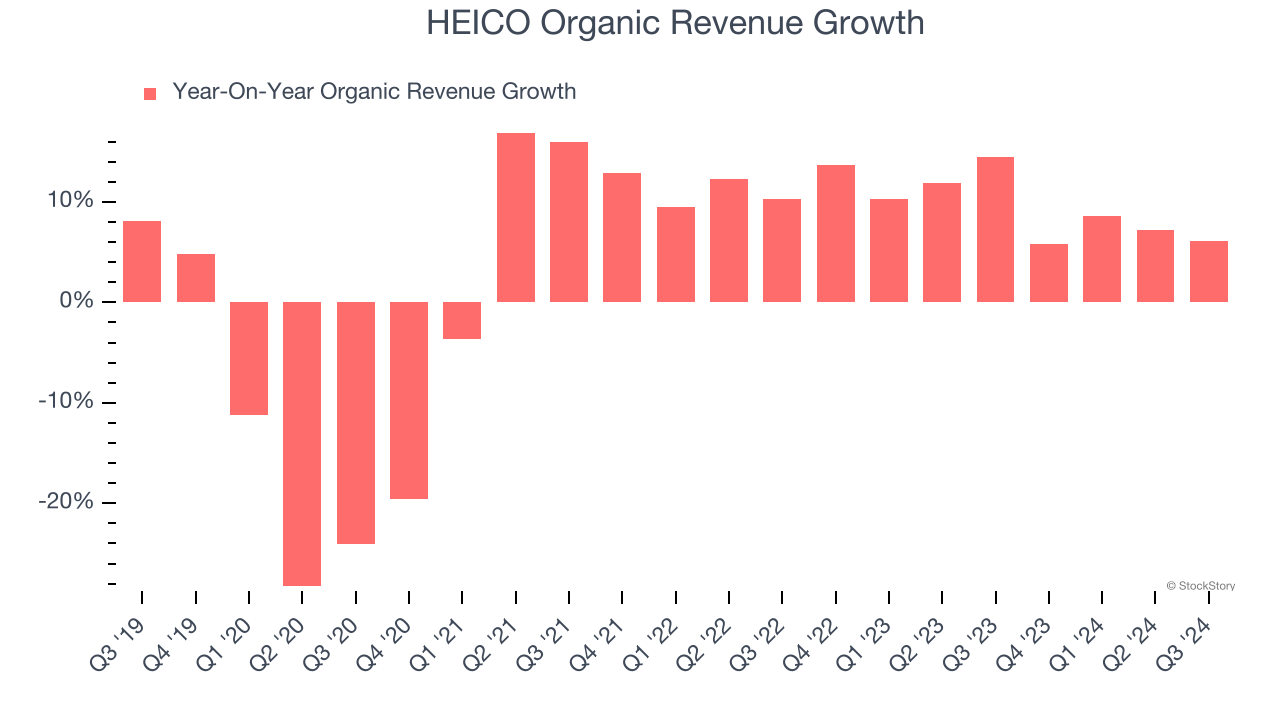
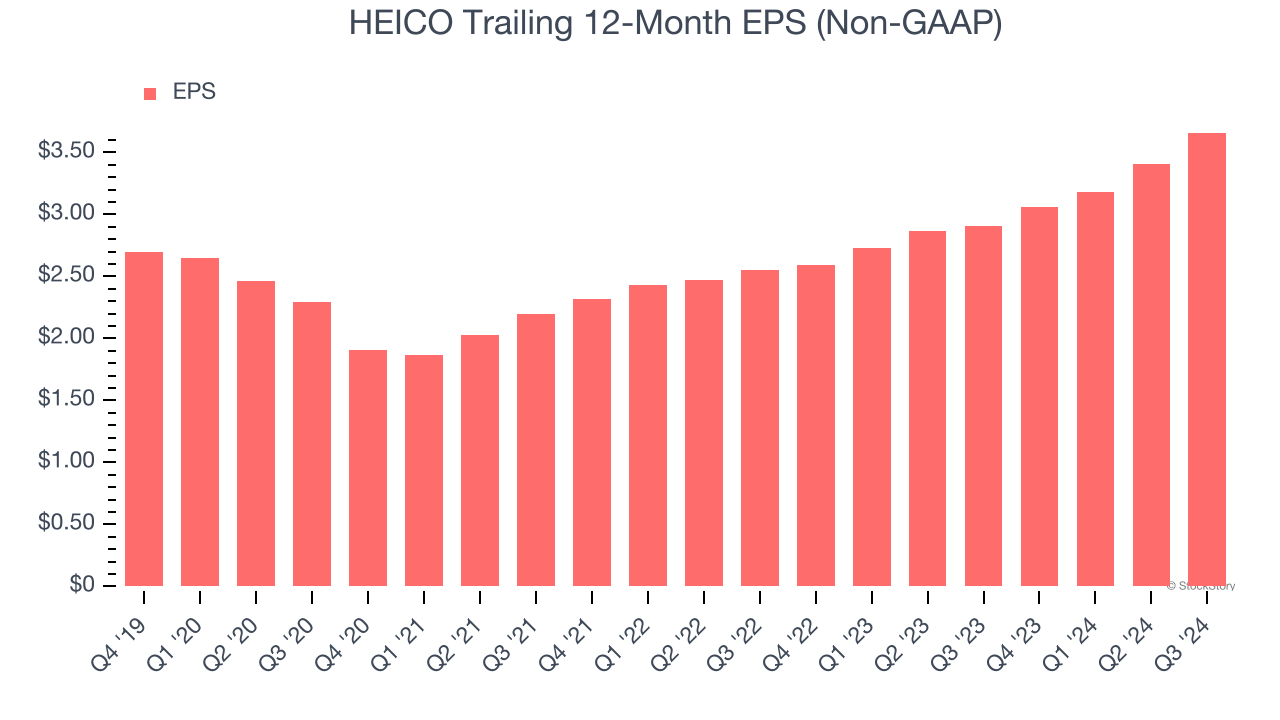
2. EPS Moving Up Steadily
We track the long-term change in earnings per share (EPS) because it highlights whether a company’s growth is profitable.
HEICO’s EPS grew at a decent 9.4% compounded annual growth rate over the last five years. This performance was better than most industrials businesses.
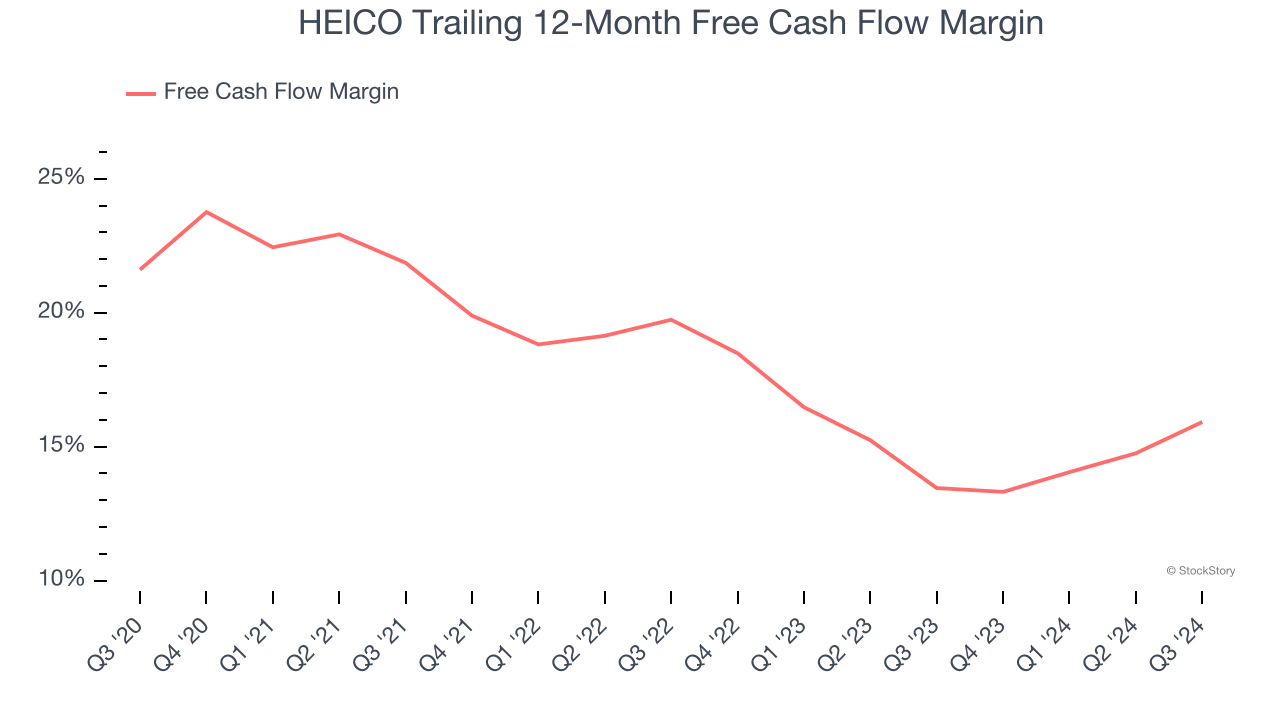
3. Excellent Free Cash Flow Margin Boosts Reinvestment Potential
If you’ve followed StockStory for a while, you know we emphasize free cash flow. Why, you ask? We believe that in the end, cash is king, and you can’t use accounting profits to pay the bills.
HEICO has shown terrific cash profitability, putting it in an advantageous position to invest in new products, return capital to investors, and consolidate the market during industry downturns. The company’s free cash flow margin was among the best in the industrials sector, averaging 17.7% over the last five years.
Final Judgment
These are just a few reasons HEICO is a high-quality business worth owning. With its shares underperforming the market lately, the stock trades at 53.9× forward price-to-earnings (or $233.80 per share). Is now the right time to buy? See for yourself in our full research report, it’s free.
Stocks We Like Even More Than HEICO
The elections are now behind us. With rates dropping and inflation cooling, many analysts expect a breakout market - and we’re zeroing in on the stocks that could benefit immensely.
Take advantage of the rebound by checking out our Top 9 Market-Beating Stocks. This is a curated list of our High Quality stocks that have generated a market-beating return of 175% over the last five years.
Stocks that made our list in 2019 include now familiar names such as Nvidia (+2,183% between December 2019 and December 2024) as well as under-the-radar businesses like Comfort Systems (+751% five-year return). Find your next big winner with StockStory today for free.


