
Zuora trades at $10 per share and has stayed right on track with the overall market, gaining 19.5% over the last six months. At the same time, the S&P 500 has returned 16.9%.
Is there a buying opportunity in Zuora, or does it present a risk to your portfolio? See what our analysts have to say in our full research report, it’s free.
We're cautious about Zuora. Here are three reasons why there are better opportunities than ZUO and a stock we'd rather own.
Why Is Zuora Not Exciting?
Founded in 2007, Zuora (NYSE: ZUO) offers software as a service platform that allows companies to bill and accept payments for recurring subscription products.
1. Weak Billings Point to Soft Demand
Billings is a non-GAAP metric that is often called “cash revenue” because it shows how much money the company has collected from customers in a certain period. This is different from revenue, which must be recognized in pieces over the length of a contract.
Zuora’s billings came in at $116.3 million in Q2, and over the last four quarters, its year-on-year growth averaged 7.2%. This performance was underwhelming and suggests that increasing competition is causing challenges in acquiring/retaining customers. 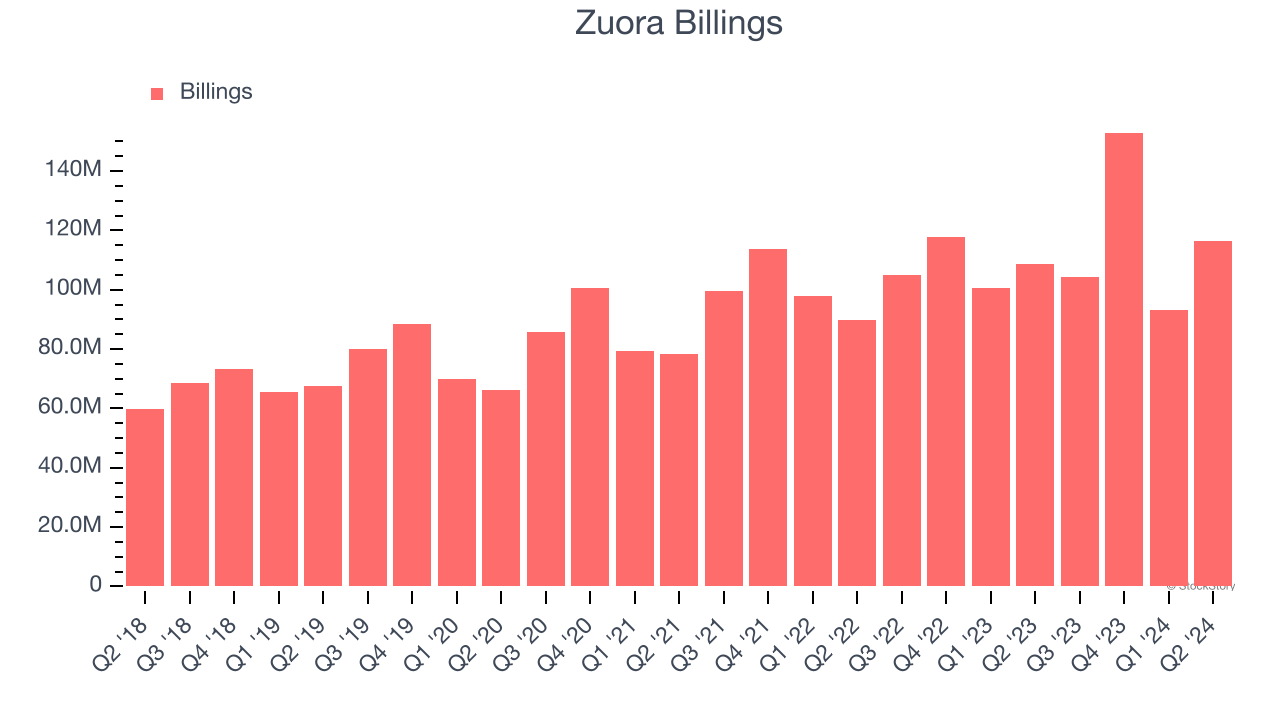
2. Projected Revenue Growth Is Slim
Forecasted revenues by Wall Street analysts signal a company’s potential. Predictions may not always be accurate, but accelerating growth typically boosts valuation multiples and stock prices while slowing growth does the opposite.
Over the next 12 months, sell-side analysts expect Zuora’s revenue to rise by 5.9%, a deceleration versus its 11.3% annualized growth for the past three years. This projection doesn't excite us and indicates its products and services will face some demand challenges.
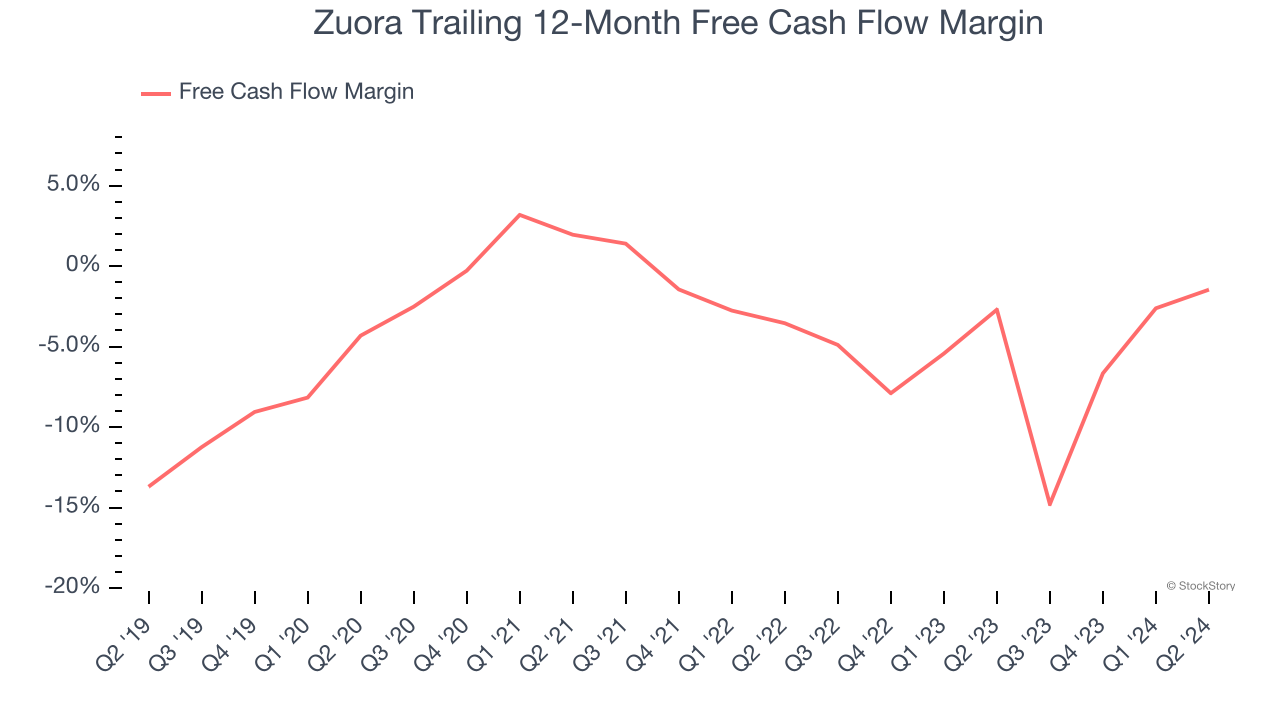
3. Cash Burn Ignites Concerns
Free cash flow isn't a prominently featured metric in company financials and earnings releases, but we think it's telling because it accounts for all operating and capital expenses, making it tough to manipulate. Cash is king.
While Zuora posted positive free cash flow this quarter, the broader story hasn’t been so clean. Zuora’s demanding reinvestments have consumed many resources over the last year, contributing to an average free cash flow margin of negative 1.5%. This means it lit $1.46 of cash on fire for every $100 in revenue.
Final Judgment
Zuora isn’t a terrible business, but it doesn’t pass our bar. That said, the stock currently trades at 3.2× forward price-to-sales (or $10 per share). While this valuation is reasonable, we don’t really see a big opportunity at the moment. We're fairly confident there are better stocks to buy right now. We’d suggest looking at a dominant Aerospace business that has perfected its M&A strategy.
Stocks We Like More Than Zuora
With rates dropping, inflation stabilizing, and the elections in the rearview mirror, all signs point to the start of a new bull run - and we’re laser-focused on finding the best stocks for this upcoming cycle.
Put yourself in the driver’s seat by checking out our Top 5 Growth Stocks for this month. This is a curated list of our High Quality stocks that have generated a market-beating return of 175% over the last five years.
Stocks that made our list in 2019 include now familiar names such as Nvidia (+2,183% between December 2019 and December 2024) as well as under-the-radar businesses like Sterling Infrastructure (+1,096% five-year return). Find your next big winner with StockStory today for free.