
Xylem has been treading water for the past six months, holding steady at $130.30.
Is now the time to buy XYL? Find out in our full research report, it’s free.
Why Does XYL Stock Spark Debate?
Formed through a spinoff, Xylem (NYSE: XYL) manufactures and services engineered products across a wide variety of applications primarily in the water sector.
Two Positive Attributes:
1. Long-Term Revenue Growth Shows Strong Momentum
A company’s long-term sales performance can indicate its overall quality. Any business can put up a good quarter or two, but the best consistently grow over the long haul. Luckily, Xylem’s sales grew at a solid 10.3% compounded annual growth rate over the last five years. Its growth beat the average industrials company and shows its offerings resonate with customers. 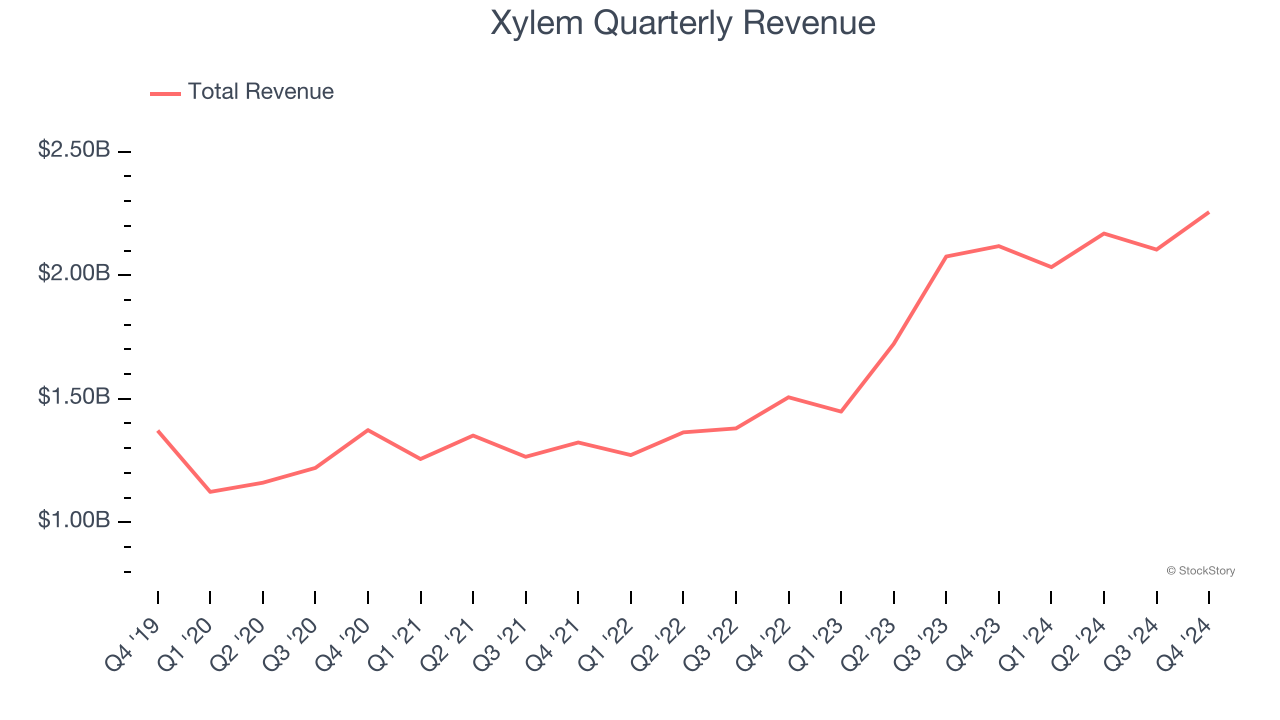
2. Organic Growth Indicates Solid Core Business
In addition to reported revenue, organic revenue is a useful data point for analyzing Water Infrastructure companies. This metric gives visibility into Xylem’s core business because it excludes one-time events such as mergers, acquisitions, and divestitures along with foreign currency fluctuations - non-fundamental factors that can manipulate the income statement.
Over the last two years, Xylem’s organic revenue averaged 9.3% year-on-year growth. This performance was solid and shows it can expand steadily without relying on expensive (and risky) acquisitions. 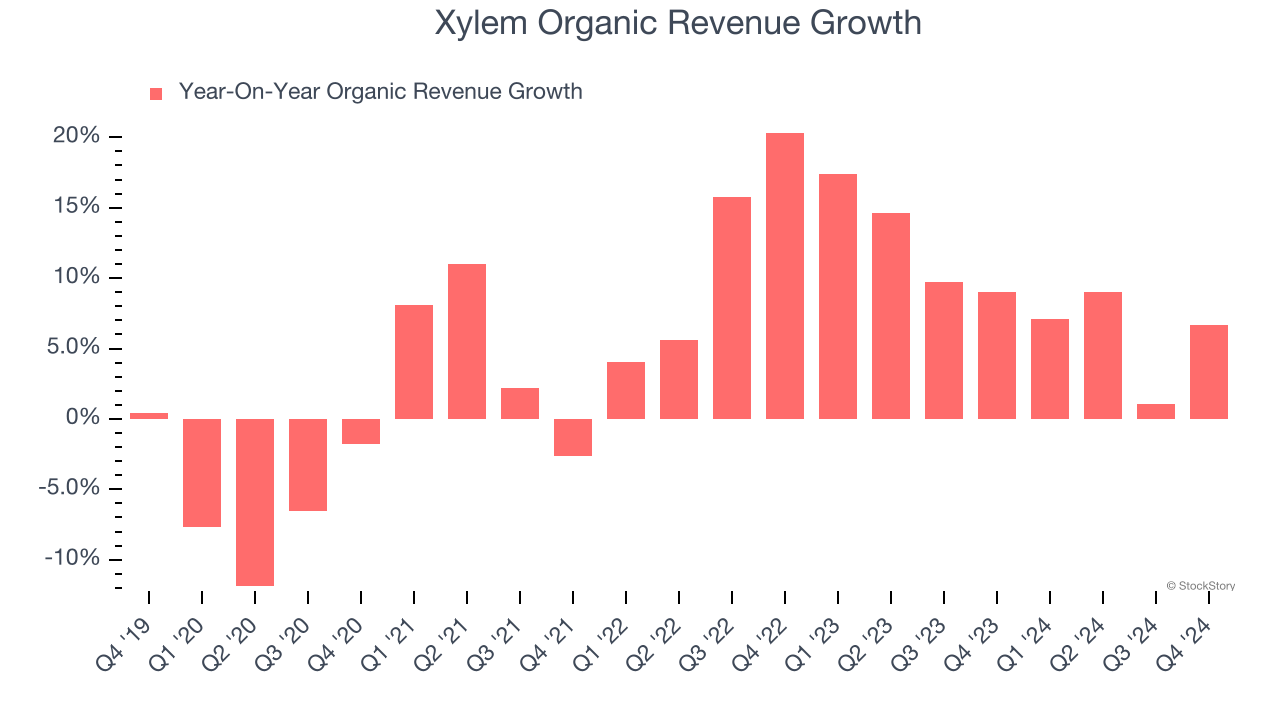
One Reason to be Careful:
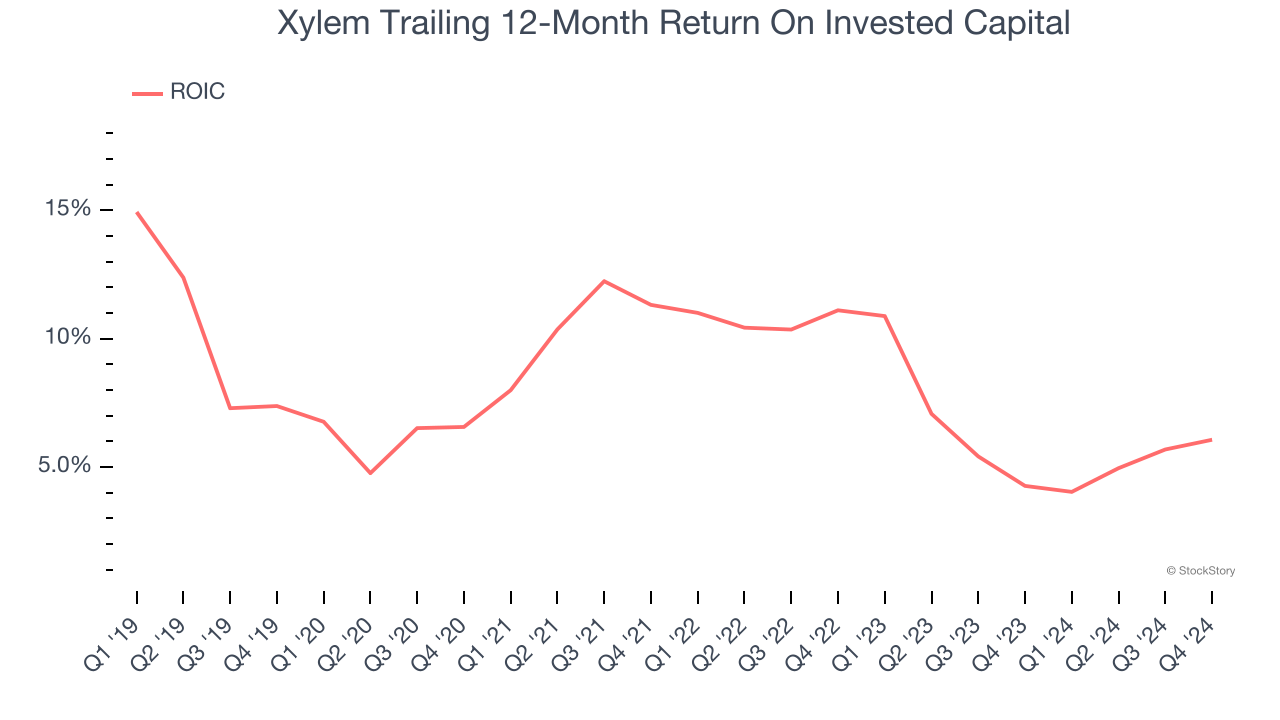
New Investments Fail to Bear Fruit as ROIC Declines
ROIC, or return on invested capital, is a metric showing how much operating profit a company generates relative to the money it has raised (debt and equity).
We like to invest in businesses with high returns, but the trend in a company’s ROIC is what often surprises the market and moves the stock price. Over the last few years, Xylem’s ROIC averaged 3.8 percentage point decreases each year. If its returns keep falling, it could suggest its profitable growth opportunities are drying up. We’ll keep a close eye.
Final Judgment
Xylem’s merits more than compensate for its flaws, but at $130.30 per share (or 28× forward price-to-earnings), is now the right time to buy the stock? See for yourself in our comprehensive research report, it’s free.
Stocks We Like Even More Than Xylem
The elections are now behind us. With rates dropping and inflation cooling, many analysts expect a breakout market - and we’re zeroing in on the stocks that could benefit immensely.
Take advantage of the rebound by checking out our Top 5 Strong Momentum Stocks for this week. This is a curated list of our High Quality stocks that have generated a market-beating return of 175% over the last five years.
Stocks that made our list in 2019 include now familiar names such as Nvidia (+2,183% between December 2019 and December 2024) as well as under-the-radar businesses like Sterling Infrastructure (+1,096% five-year return). Find your next big winner with StockStory today for free.