Diebold Nixdorf has followed the market’s trajectory closely, rising in tandem with the S&P 500 over the past six months. The stock has climbed by 7.8% to $43.96 per share while the index has gained 3.8%.
Is now the time to buy Diebold Nixdorf, or should you be careful about including it in your portfolio? Get the full stock story straight from our expert analysts, it’s free.
We're cautious about Diebold Nixdorf. Here are three reasons why there are better opportunities than DBD and a stock we'd rather own.
Why Is Diebold Nixdorf Not Exciting?
With roots dating back to 1859 and a presence in over 100 countries, Diebold Nixdorf (NYSE: DBD) provides automated self-service technology, software, and services that help banks and retailers manage transactions and customer experiences.
1. Revenue Spiraling Downwards
A company’s long-term sales performance is one signal of its overall quality. Any business can put up a good quarter or two, but many enduring ones grow for years. Over the last five years, Diebold Nixdorf’s demand was weak and its revenue declined by 3.2% per year. This was below our standards and signals it’s a lower quality business. 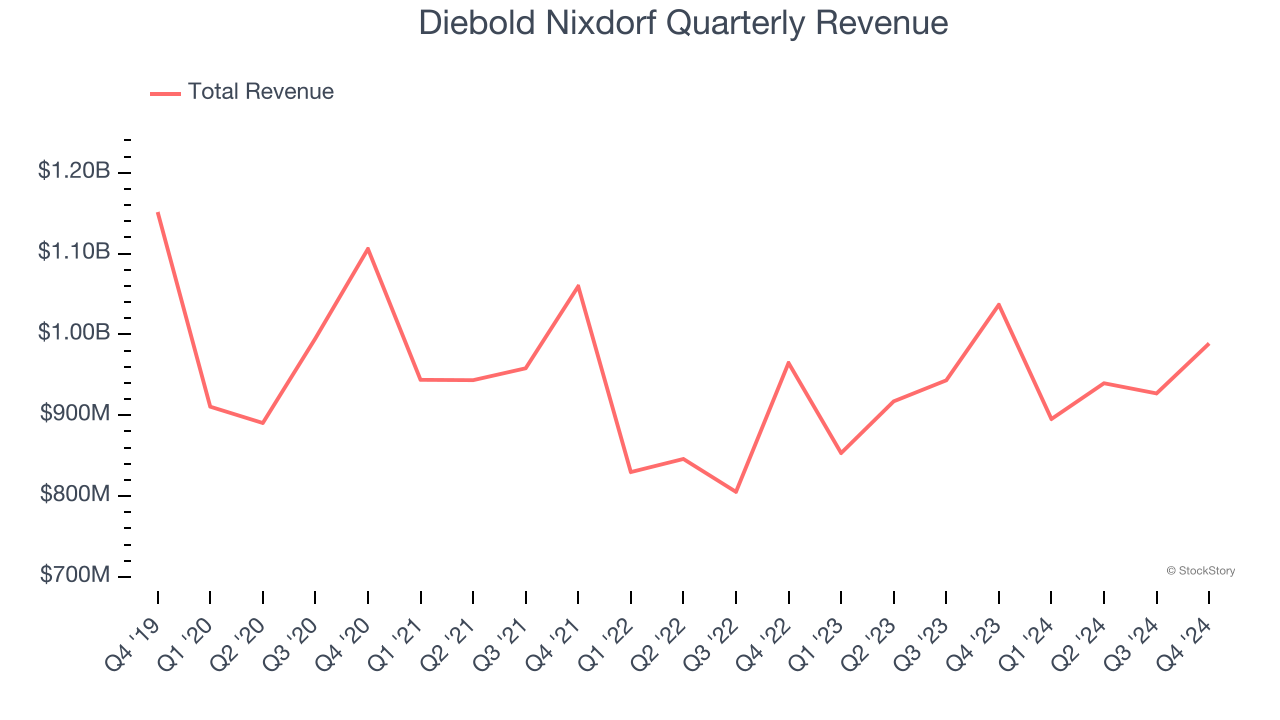
2. Projected Revenue Growth Shows Limited Upside
Forecasted revenues by Wall Street analysts signal a company’s potential. Predictions may not always be accurate, but accelerating growth typically boosts valuation multiples and stock prices while slowing growth does the opposite.
Over the next 12 months, sell-side analysts expect Diebold Nixdorf’s revenue to stall, a deceleration versus its 4.3% annualized growth for the past two years. This projection doesn't excite us and suggests its products and services will see some demand headwinds.
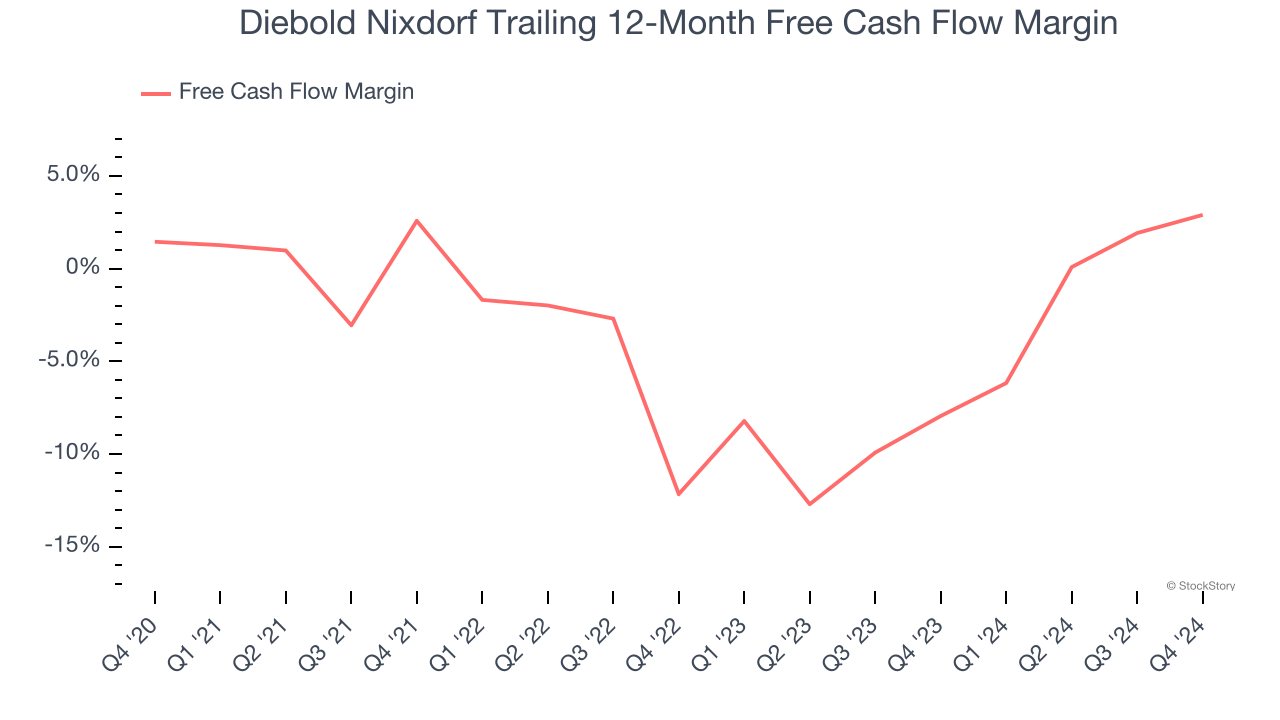
3. Cash Burn Ignites Concerns
Free cash flow isn't a prominently featured metric in company financials and earnings releases, but we think it's telling because it accounts for all operating and capital expenses, making it tough to manipulate. Cash is king.
While Diebold Nixdorf posted positive free cash flow this quarter, the broader story hasn’t been so clean. Diebold Nixdorf’s demanding reinvestments have drained its resources over the last five years, putting it in a pinch and limiting its ability to return capital to investors. Its free cash flow margin averaged negative 2.4%, meaning it lit $2.40 of cash on fire for every $100 in revenue.
Final Judgment
Diebold Nixdorf isn’t a terrible business, but it doesn’t pass our bar. That said, the stock currently trades at 8.9× forward price-to-earnings (or $43.96 per share). While this valuation is reasonable, we don’t really see a big opportunity at the moment. We're pretty confident there are more exciting stocks to buy at the moment. Let us point you toward a top digital advertising platform riding the creator economy.
Stocks We Would Buy Instead of Diebold Nixdorf
With rates dropping, inflation stabilizing, and the elections in the rearview mirror, all signs point to the start of a new bull run - and we’re laser-focused on finding the best stocks for this upcoming cycle.
Put yourself in the driver’s seat by checking out our Top 6 Stocks for this week. This is a curated list of our High Quality stocks that have generated a market-beating return of 175% over the last five years.
Stocks that made our list in 2019 include now familiar names such as Nvidia (+2,183% between December 2019 and December 2024) as well as under-the-radar businesses like Sterling Infrastructure (+1,096% five-year return). Find your next big winner with StockStory today for free.