
John Bean has been on fire lately. In the past six months alone, the company’s stock price has rocketed 46.5%, reaching $125.32 per share. This was partly thanks to its solid quarterly results, and the performance may have investors wondering how to approach the situation.
Is now the time to buy John Bean, or should you be careful about including it in your portfolio? Check out our in-depth research report to see what our analysts have to say, it’s free.
We’re happy investors have made money, but we don't have much confidence in John Bean. Here are three reasons why there are better opportunities than JBT and a stock we'd rather own.
Why Do We Think John Bean Will Underperform?
Tracing back to its invention of the mechanical milk bottle filler in 1884, John Bean (NYSE: JBT) designs, manufactures, and sells equipment used for food processing and aviation.
1. Revenue Spiraling Downwards
Reviewing a company’s long-term sales performance reveals insights into its quality. Any business can put up a good quarter or two, but the best consistently grow over the long haul. John Bean’s demand was weak over the last five years as its sales fell at a 2.7% annual rate. This was below our standards and signals it’s a low quality business. 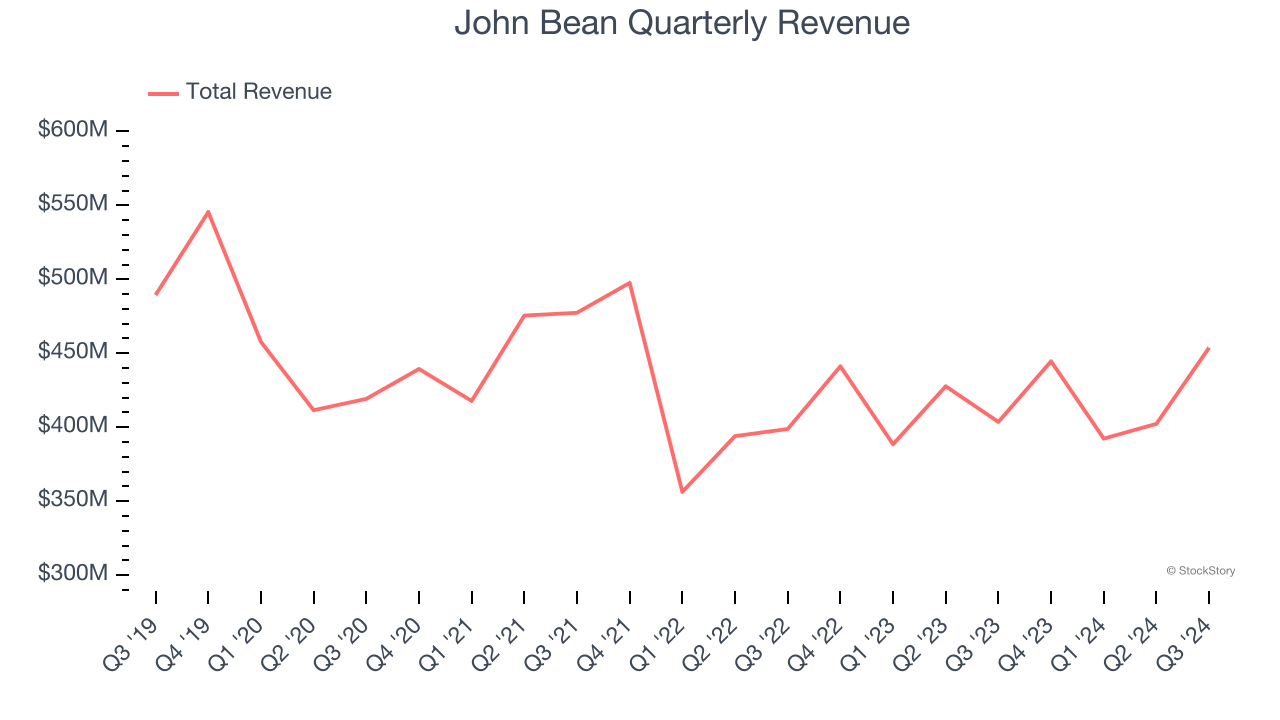
2. Slow Organic Growth Suggests Waning Demand In Core Business
We can better understand General Industrial Machinery companies by analyzing their organic revenue. This metric gives visibility into John Bean’s core business because it excludes one-time events such as mergers, acquisitions, and divestitures along with foreign currency fluctuations - non-fundamental factors that can manipulate the income statement.
Over the last two years, John Bean’s organic revenue averaged 1.7% year-on-year growth. This performance was underwhelming and suggests it may need to improve its products, pricing, or go-to-market strategy, which can add an extra layer of complexity to its operations. 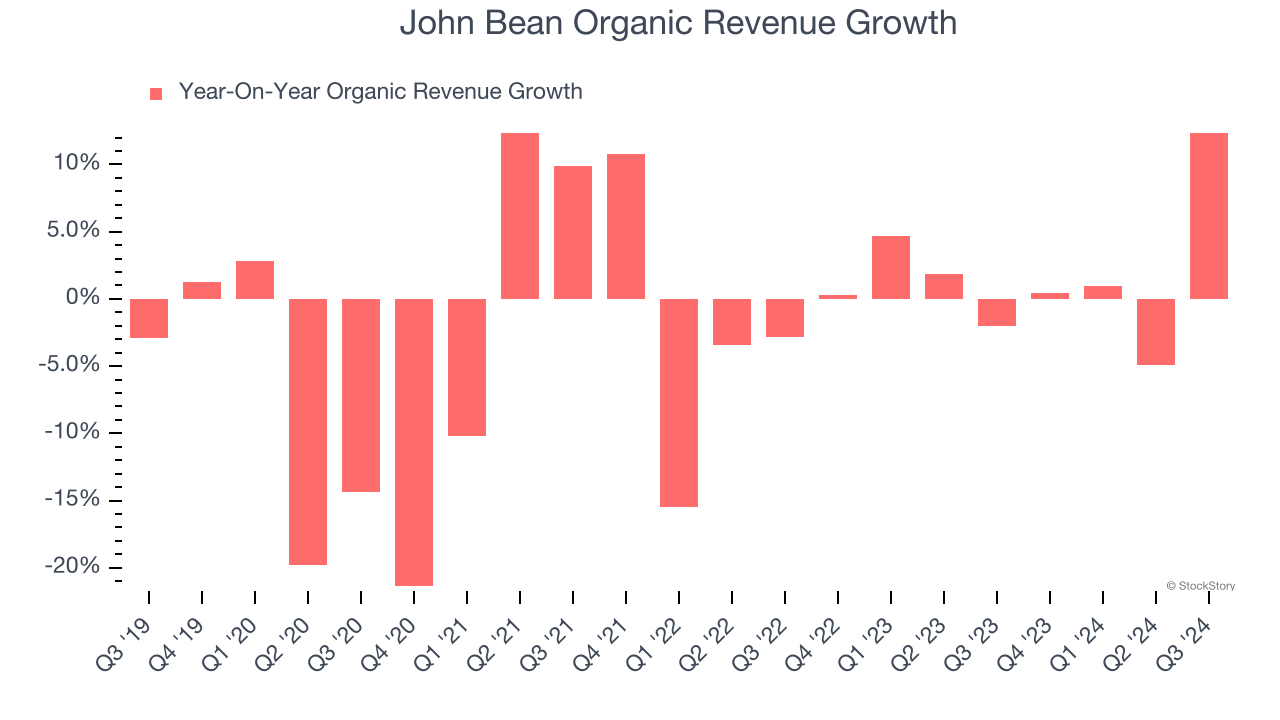
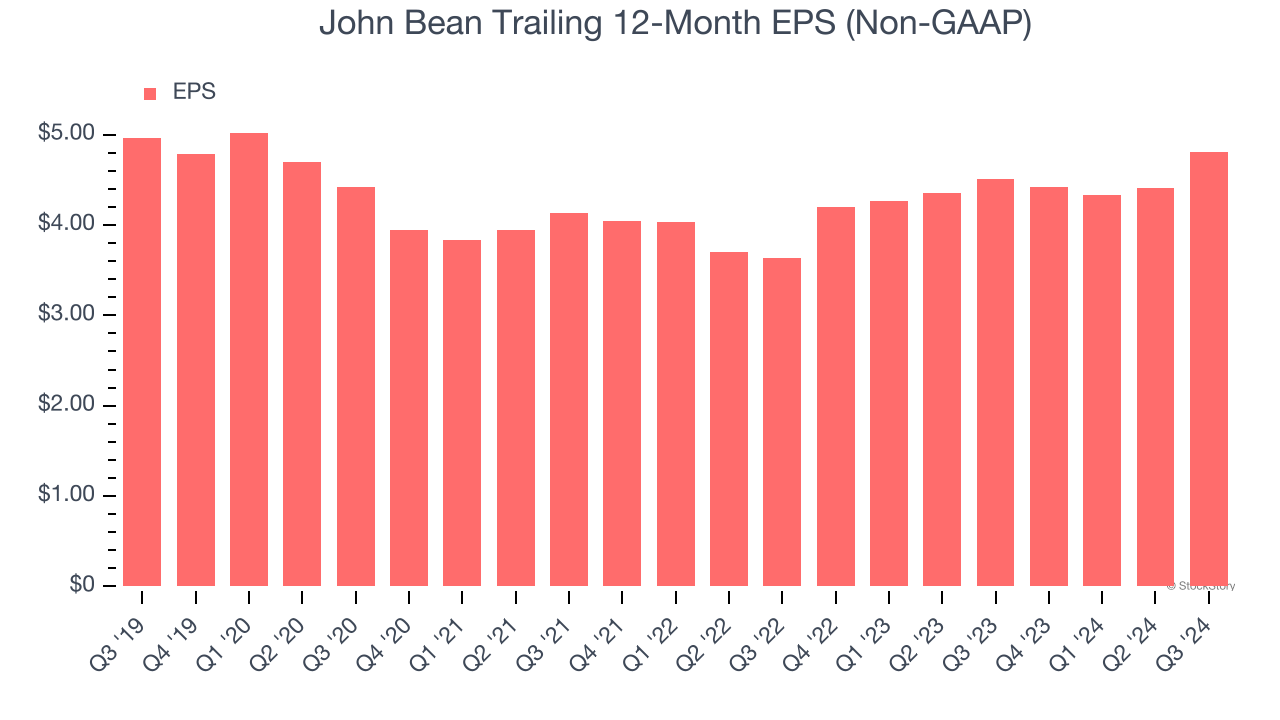
3. EPS Growth Has Stalled
Analyzing the long-term change in earnings per share (EPS) shows whether a company's incremental sales were profitable – for example, revenue could be inflated through excessive spending on advertising and promotions.
John Bean’s flat EPS over the last five years was weak. On the bright side, this performance was better than its 2.7% annualized revenue declines.
Final Judgment
John Bean falls short of our quality standards. After the recent surge, the stock trades at 22.4× forward price-to-earnings (or $125.32 per share). At this valuation, there’s a lot of good news priced in - you can find better investment opportunities elsewhere. Let us point you toward a top digital advertising platform riding the creator economy.
Stocks We Like More Than John Bean
With rates dropping, inflation stabilizing, and the elections in the rearview mirror, all signs point to the start of a new bull run - and we’re laser-focused on finding the best stocks for this upcoming cycle.
Put yourself in the driver’s seat by checking out our Top 6 Stocks for this week. This is a curated list of our High Quality stocks that have generated a market-beating return of 175% over the last five years.
Stocks that made our list in 2019 include now familiar names such as Nvidia (+2,183% between December 2019 and December 2024) as well as under-the-radar businesses like Sterling Infrastructure (+1,096% five-year return). Find your next big winner with StockStory today for free.


