
Over the last six months, Textron’s shares have sunk to $73.65, producing a disappointing 15.3% loss while the S&P 500 was flat. This was partly driven by its softer quarterly results and may have investors wondering how to approach the situation.
Is there a buying opportunity in Textron, or does it present a risk to your portfolio? See what our analysts have to say in our full research report, it’s free.
Despite the more favorable entry price, we're sitting this one out for now. Here are three reasons why TXT doesn't excite us and a stock we'd rather own.
Why Is Textron Not Exciting?
Listed on the NYSE in 1947, Textron (NYSE: TXT) provides products and services in the aerospace, defense, industrial, and finance sectors.
1. Slow Organic Growth Suggests Waning Demand In Core Business
We can better understand Aerospace companies by analyzing their organic revenue. This metric gives visibility into Textron’s core business because it excludes one-time events such as mergers, acquisitions, and divestitures along with foreign currency fluctuations - non-fundamental factors that can manipulate the income statement.
Over the last two years, Textron’s organic revenue averaged 3.3% year-on-year growth. This performance was underwhelming and suggests it may need to improve its products, pricing, or go-to-market strategy, which can add an extra layer of complexity to its operations. 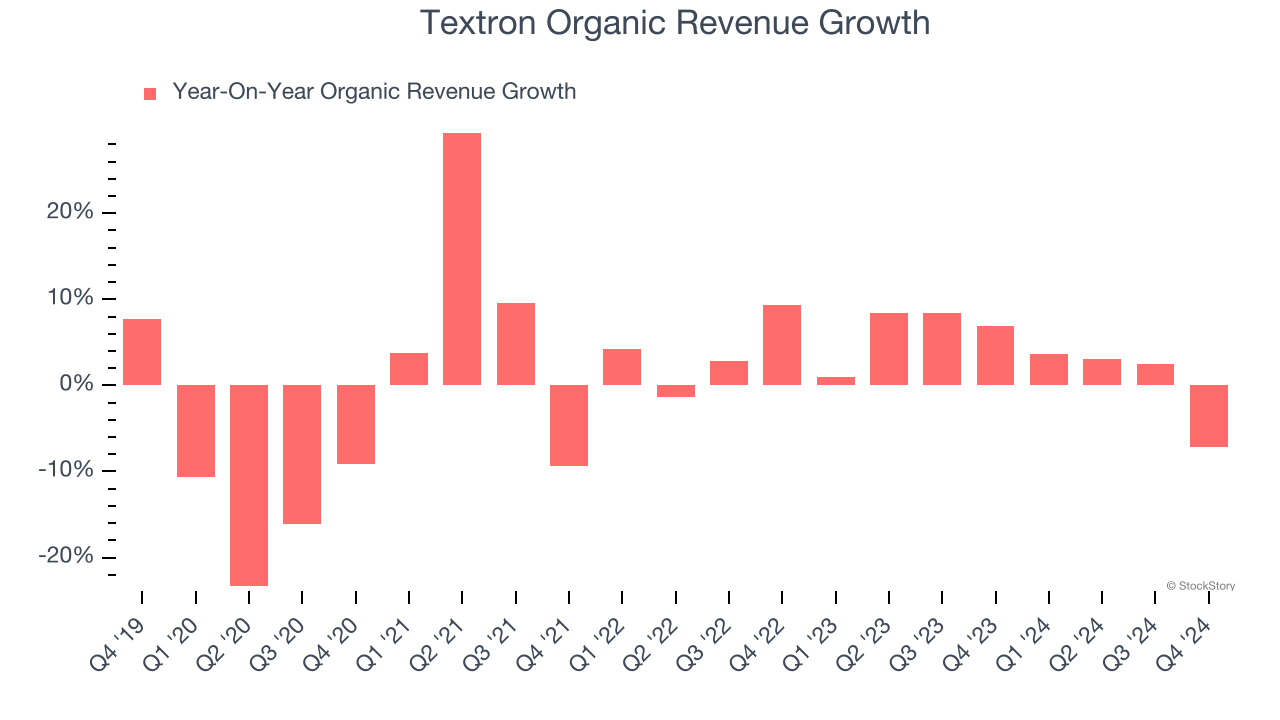
2. Projected Revenue Growth Is Slim
Forecasted revenues by Wall Street analysts signal a company’s potential. Predictions may not always be accurate, but accelerating growth typically boosts valuation multiples and stock prices while slowing growth does the opposite.
Over the next 12 months, sell-side analysts expect Textron’s revenue to rise by 7%. Although this projection indicates its newer products and services will spur better top-line performance, it is still below the sector average.
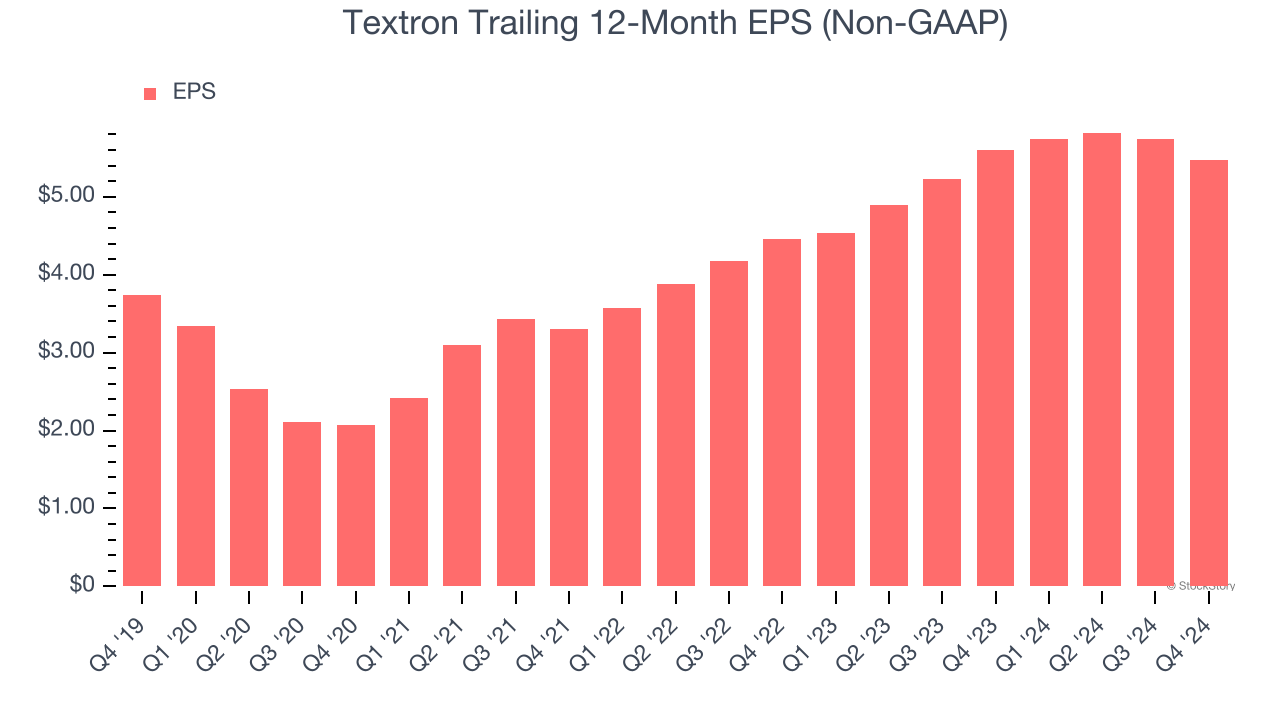
3. EPS Barely Growing
Analyzing the long-term change in earnings per share (EPS) shows whether a company's incremental sales were profitable – for example, revenue could be inflated through excessive spending on advertising and promotions.
Textron’s EPS grew at an unimpressive 7.9% compounded annual growth rate over the last five years. On the bright side, this performance was better than its flat revenue and tells us management responded to softer demand by adapting its cost structure.
Final Judgment
Textron isn’t a terrible business, but it doesn’t pass our bar. After the recent drawdown, the stock trades at 11.8× forward price-to-earnings (or $73.65 per share). While this valuation is fair, the upside isn’t great compared to the potential downside. We're pretty confident there are more exciting stocks to buy at the moment. We’d recommend looking at an all-weather company that owns household favorite Taco Bell.
Stocks We Would Buy Instead of Textron
The elections are now behind us. With rates dropping and inflation cooling, many analysts expect a breakout market - and we’re zeroing in on the stocks that could benefit immensely.
Take advantage of the rebound by checking out our Top 5 Strong Momentum Stocks for this week. This is a curated list of our High Quality stocks that have generated a market-beating return of 175% over the last five years.
Stocks that made our list in 2019 include now familiar names such as Nvidia (+2,183% between December 2019 and December 2024) as well as under-the-radar businesses like Sterling Infrastructure (+1,096% five-year return). Find your next big winner with StockStory today for free.


