Creative software maker Adobe (NASDAQ: ADBE) reported Q1 CY2025 results beating Wall Street’s revenue expectations, with sales up 10.3% year on year to $5.71 billion. The company expects next quarter’s revenue to be around $5.80 billion, close to analysts’ estimates. Its non-GAAP profit of $5.08 per share was 2.2% above analysts’ consensus estimates.
Is now the time to buy Adobe? Find out by accessing our full research report, it’s free.
Adobe (ADBE) Q1 CY2025 Highlights:
- Revenue: $5.71 billion vs analyst estimates of $5.66 billion (10.3% year-on-year growth, 1% beat)
- Adjusted EPS: $5.08 vs analyst estimates of $4.97 (2.2% beat)
- Adjusted Operating Income: $2.72 billion vs analyst estimates of $2.66 billion (47.5% margin, 1.9% beat)
- The company reconfirmed its revenue guidance for the full year of $23.43 billion at the midpoint
- Management reiterated its full-year Adjusted EPS guidance of $20.35 at the midpoint
- Operating Margin: 37.9%, up from 17.5% in the same quarter last year
- Free Cash Flow Margin: 43%, down from 51.2% in the previous quarter
- Billings: $5.95 billion at quarter end, up 11.3% year on year
- Market Capitalization: $188.6 billion
“Adobe’s success over the next decade will be driven by customer-focused innovation and new offerings for creators, marketing professionals, business professionals and consumers,” said Shantanu Narayen, chair and CEO, Adobe.
Company Overview
One of the most well-known Silicon Valley software companies around, Adobe (NASDAQ: ADBE) is a leading provider of software as service in the digital design and document management space.
Design Software
The demand for rich, interactive 2D, 3D, VR and AR experiences is growing, and while the ubiquitous metaverse might still be more of a buzzword than a real thing, what is real is the demand for the tools to create these experiences, whether they are games, 3D tours or interactive movies.
Sales Growth
A company’s long-term sales performance can indicate its overall quality. Any business can put up a good quarter or two, but the best consistently grow over the long haul. Over the last three years, Adobe grew its sales at a 10.9% annual rate. Although this growth is acceptable on an absolute basis, it fell short of our standards for the software sector, which enjoys a number of secular tailwinds. Luckily, there are other things to like about Adobe.
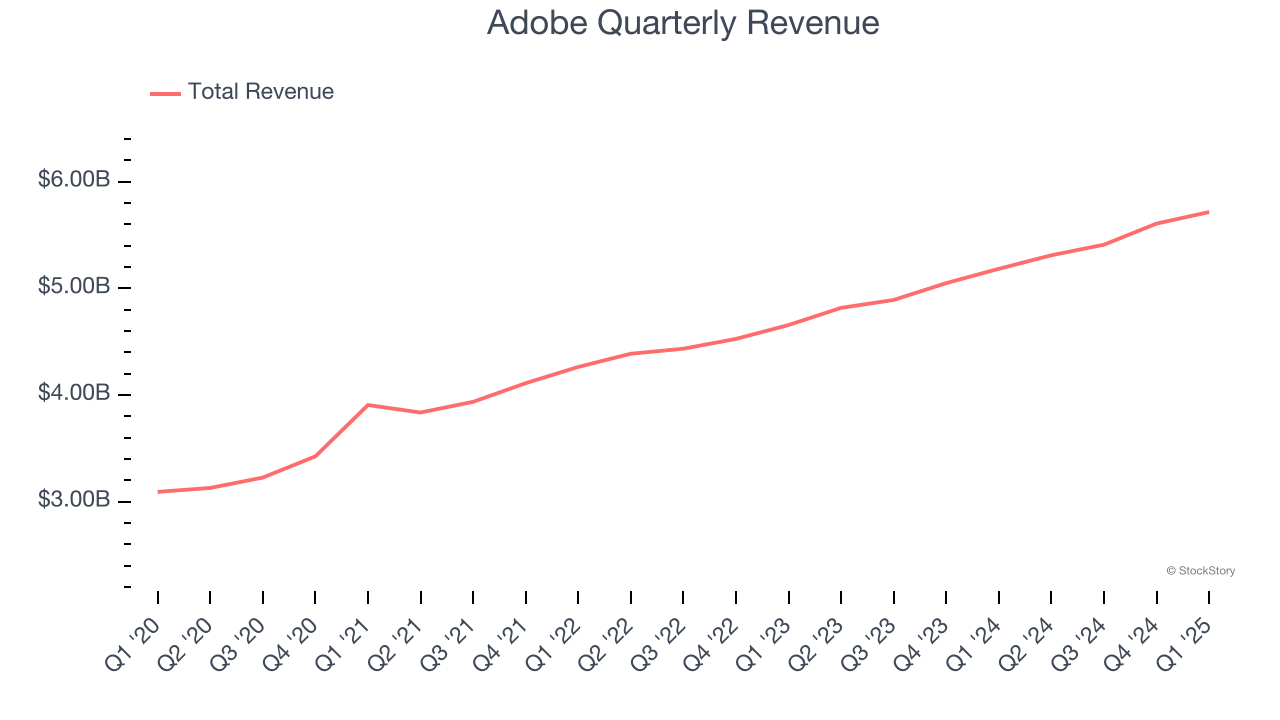
This quarter, Adobe reported year-on-year revenue growth of 10.3%, and its $5.71 billion of revenue exceeded Wall Street’s estimates by 1%. Company management is currently guiding for a 9.2% year-on-year increase in sales next quarter.
Looking further ahead, sell-side analysts expect revenue to grow 9% over the next 12 months, a slight deceleration versus the last three years. This projection doesn't excite us and implies its products and services will face some demand challenges. At least the company is tracking well in other measures of financial health.
Software is eating the world and there is virtually no industry left that has been untouched by it. That drives increasing demand for tools helping software developers do their jobs, whether it be monitoring critical cloud infrastructure, integrating audio and video functionality, or ensuring smooth content streaming. Click here to access a free report on our 3 favorite stocks to play this generational megatrend.
Billings
Billings is a non-GAAP metric that is often called “cash revenue” because it shows how much money the company has collected from customers in a certain period. This is different from revenue, which must be recognized in pieces over the length of a contract.
Adobe’s billings came in at $5.95 billion in Q1, and over the last four quarters, its growth was underwhelming as it averaged 8.9% year-on-year increases. This performance mirrored its total sales and suggests that increasing competition is causing challenges in acquiring/retaining customers. 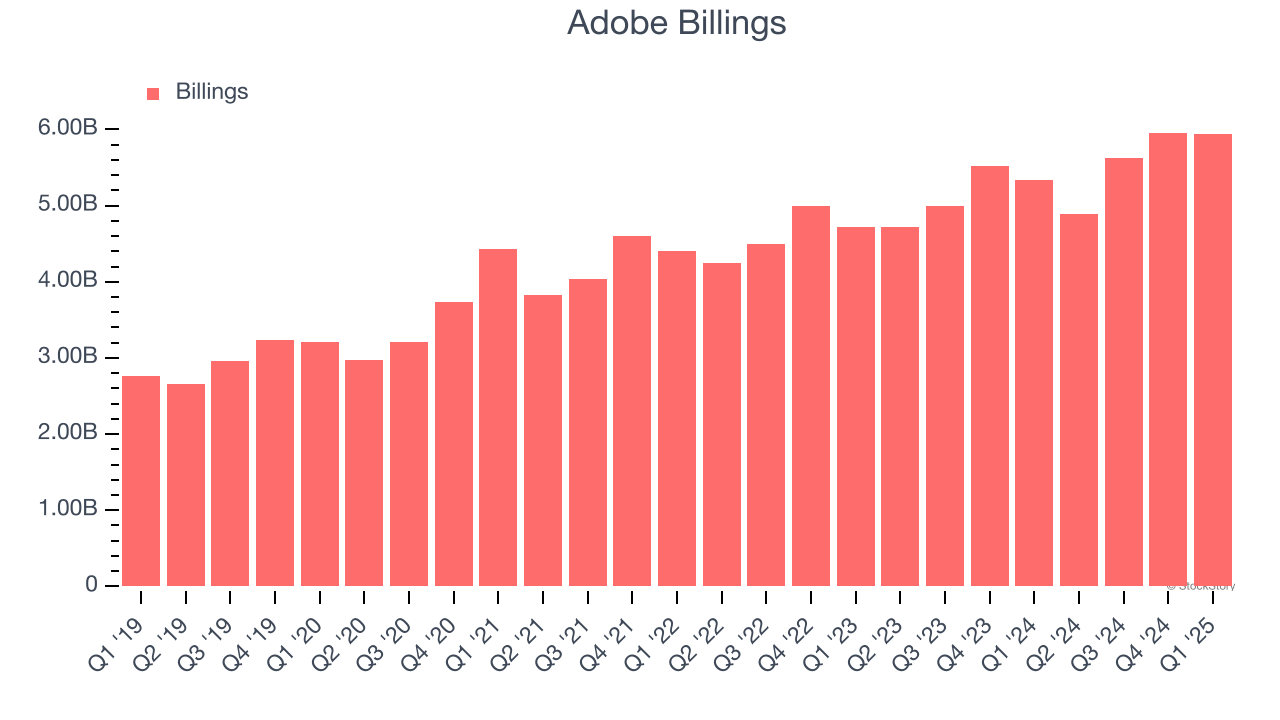
Customer Acquisition Efficiency
The customer acquisition cost (CAC) payback period represents the months required to recover the cost of acquiring a new customer. Essentially, it’s the break-even point for sales and marketing investments. A shorter CAC payback period is ideal, as it implies better returns on investment and business scalability.
Adobe is efficient at acquiring new customers, and its CAC payback period checked in at 39.3 months this quarter. The company’s relatively fast recovery of its customer acquisition costs means it can attempt to spur growth by increasing its sales and marketing investments. 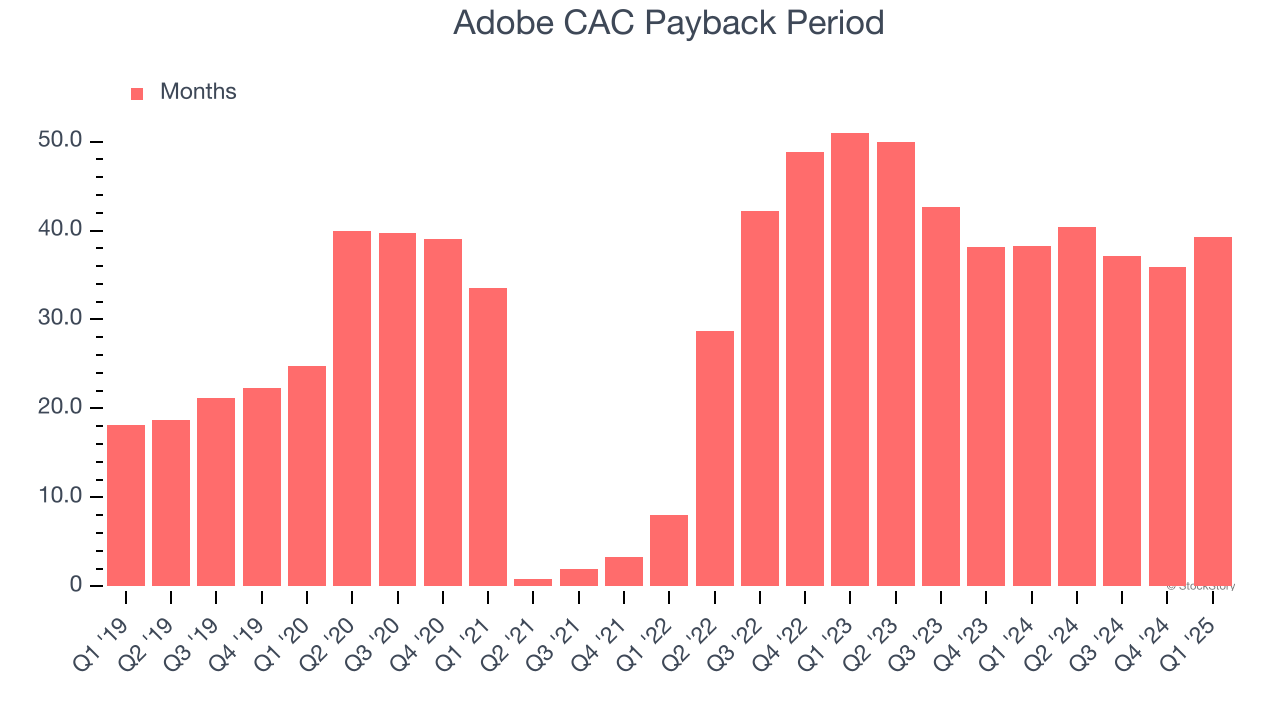
Key Takeaways from Adobe’s Q1 Results
It was good to see Adobe narrowly top analysts’ billings and revenue expectations this quarter. We were also happy its EPS and adjusted operating income outperformed. On a dimmer note, its full-year revenue and EPS guidance was in line with Wall Street’s estimates. Overall, this quarter was fine - nothing special. The stock traded down 1.3% to $433.01 immediately after reporting.
So do we think Adobe is an attractive buy at the current price? What happened in the latest quarter matters, but not as much as longer-term business quality and valuation, when deciding whether to invest in this stock. We cover that in our actionable full research report which you can read here, it’s free.