Quarterly earnings results are a good time to check in on a company’s progress, especially compared to its peers in the same sector. Today we are looking at CACI (NYSE: CACI) and the best and worst performers in the defense contractors industry.
Defense contractors typically require technical expertise and government clearance. Companies in this sector can also enjoy long-term contracts with government bodies, leading to more predictable revenues. Combined, these factors create high barriers to entry and can lead to limited competition. Lately, geopolitical tensions–whether it be Russia’s invasion of Ukraine or China’s aggression towards Taiwan–highlight the need for defense spending. On the other hand, demand for these products can ebb and flow with defense budgets and even who is president, as different administrations can have vastly different ideas of how to allocate federal funds.
The 14 defense contractors stocks we track reported a mixed Q4. As a group, revenues beat analysts’ consensus estimates by 2.6% while next quarter’s revenue guidance was 4% above.
While some defense contractors stocks have fared somewhat better than others, they have collectively declined. On average, share prices are down 2.5% since the latest earnings results.
CACI (NYSE: CACI)
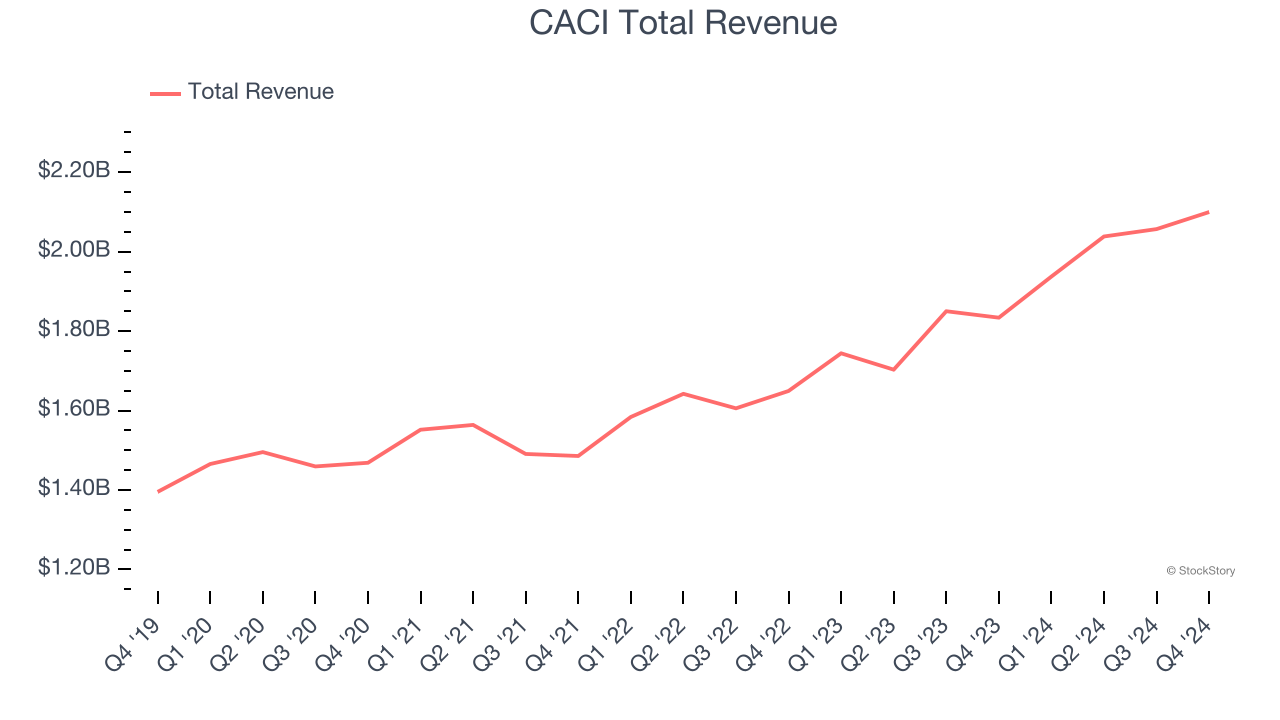
Founded to commercialize SIMSCRIPT, CACI International (NYSE: CACI) offers defense, intelligence, and IT solutions to support national security and government transformation efforts.
CACI reported revenues of $2.1 billion, up 14.5% year on year. This print exceeded analysts’ expectations by 3.4%. Overall, it was an exceptional quarter for the company with a solid beat of analysts’ backlog and EBITDA estimates.
“Our second quarter reflected another exceptional period for CACI. Financial results were strong across the board with double-digit revenue growth, increased profitability, healthy cash flow, and growing backlog. In addition, we closed and integrated the previously announced strategic acquisitions of Azure Summit and Applied Insight,” said John Mengucci, CACI President and Chief Executive Officer.
The stock is down 21.1% since reporting and currently trades at $367.04.
Is now the time to buy CACI? Access our full analysis of the earnings results here, it’s free.
Best Q4: Mercury Systems (NASDAQ: MRCY)
Founded in 1981, Mercury Systems (NASDAQ: MRCY) specializes in providing processing subsystems and components for primarily defense applications.
Mercury Systems reported revenues of $223.1 million, up 13% year on year, outperforming analysts’ expectations by 23.9%. The business had an incredible quarter with an impressive beat of analysts’ organic revenue estimates and a solid beat of analysts’ EPS estimates.
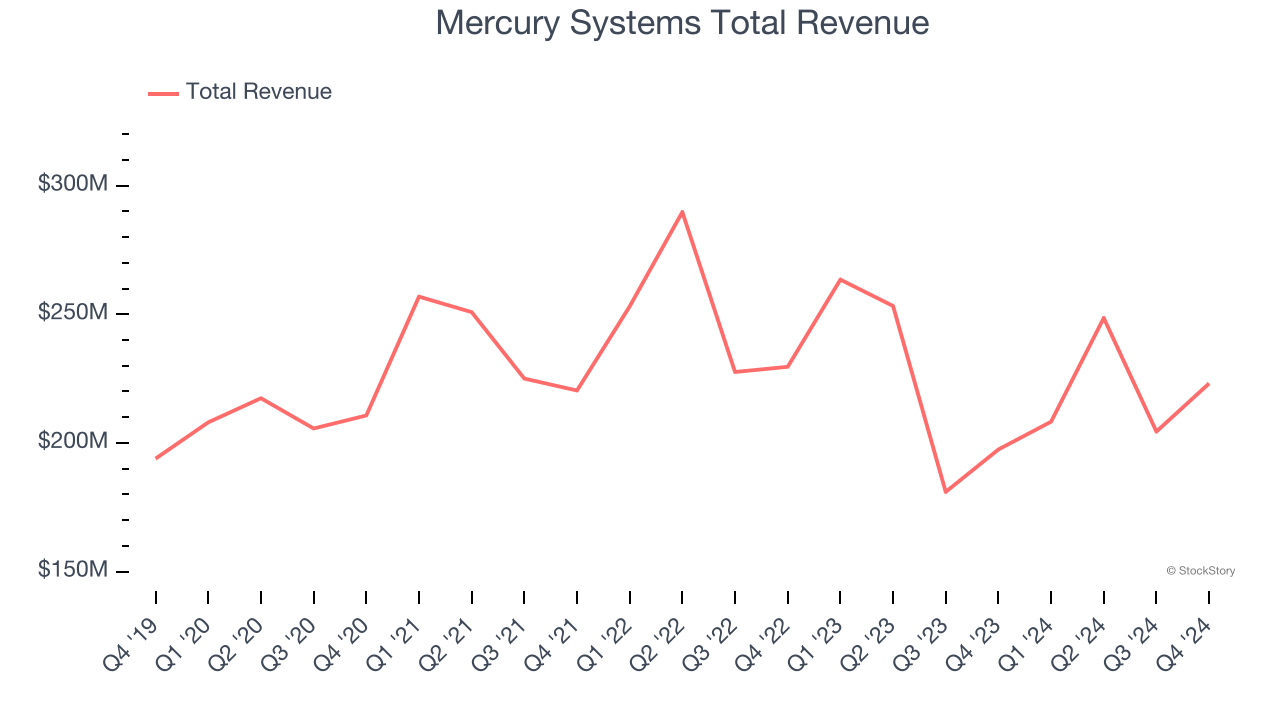
Mercury Systems delivered the biggest analyst estimates beat among its peers. The market seems content with the results as the stock is up 2.7% since reporting. It currently trades at $43.24.
Is now the time to buy Mercury Systems? Access our full analysis of the earnings results here, it’s free.
Weakest Q4: AeroVironment (NASDAQ: AVAV)
Focused on the future of autonomous military combat, AeroVironment (NASDAQ: AVAV) specializes in advanced unmanned aircraft systems and electric vehicle charging solutions.
AeroVironment reported revenues of $167.6 million, down 10.2% year on year, falling short of analysts’ expectations by 10.9%. It was a disappointing quarter as it posted full-year revenue guidance missing analysts’ expectations.
AeroVironment delivered the weakest performance against analyst estimates, slowest revenue growth, and weakest full-year guidance update in the group. As expected, the stock is down 12% since the results and currently trades at $125.01.
Read our full analysis of AeroVironment’s results here.
Parsons (NYSE: PSN)
Delivering aerospace technology during the Cold War-era, Parsons (NYSE: PSN) offers engineering, construction, and cybersecurity solutions for the infrastructure and defense sectors.
Parsons reported revenues of $1.73 billion, up 16.1% year on year. This number came in 1.3% below analysts' expectations. It was a slower quarter as it also recorded full-year EBITDA guidance missing analysts’ expectations.
The stock is down 22.3% since reporting and currently trades at $57.09.
Read our full, actionable report on Parsons here, it’s free.
KBR (NYSE: KBR)
Known for projects like the construction of Guantanamo Bay, KBR provides professional services and technologies, specializing in engineering, construction, and government services sectors.
KBR reported revenues of $2.12 billion, up 22.7% year on year. This print surpassed analysts’ expectations by 6.7%. It was a strong quarter as it also recorded a solid beat of analysts’ adjusted operating income estimates.
KBR pulled off the fastest revenue growth among its peers. The stock is up 2.6% since reporting and currently trades at $51.48.
Read our full, actionable report on KBR here, it’s free.
Want to invest in winners with rock-solid fundamentals? Check out our Top 6 Stocks and add them to your watchlist. These companies are poised for growth regardless of the political or macroeconomic climate.
Join Paid Stock Investor Research
Help us make StockStory more helpful to investors like yourself. Join our paid user research session and receive a $50 Amazon gift card for your opinions. Sign up here.