
Bedding and comfort retailer Purple (NASDAQ: PRPL) met Wall Street’s revenue expectations in Q4 CY2024, but sales fell by 11.6% year on year to $129 million. On the other hand, next quarter’s revenue guidance of $104.5 million was less impressive, coming in 10.8% below analysts’ estimates. Its non-GAAP loss of $0.07 per share was 14% above analysts’ consensus estimates.
Is now the time to buy Purple? Find out by accessing our full research report, it’s free.
Purple (PRPL) Q4 CY2024 Highlights:
- Revenue: $129 million vs analyst estimates of $129.1 million (11.6% year-on-year decline, in line)
- Adjusted EPS: -$0.07 vs analyst estimates of -$0.08 (14% beat)
- Adjusted EBITDA: $2.87 million vs analyst estimates of $1.96 million (2.2% margin, relatively in line)
- Management’s revenue guidance for the upcoming financial year 2025 is $475 million at the midpoint, missing analyst estimates by 4.4% and implying -2.6% growth (vs -3.1% in FY2024)
- EBITDA guidance for the upcoming financial year 2025 is $5 million at the midpoint, above analyst estimates of -$80,290
- Operating Margin: -6%, up from -11.1% in the same quarter last year
- Free Cash Flow was $5.68 million, up from -$4.48 million in the same quarter last year
- Market Capitalization: $75.85 million
"Purple achieved a significant milestone in the fourth quarter, returning to positive Adjusted EBITDA for the first time in eight quarters and generating positive cash flow," said CEO Rob DeMartini.
Company Overview
Founded by two brothers, Purple (NASDAQ: PRPL) creates sleep and home comfort products such as mattresses, pillows, and bedding accessories.
Home Furnishings
A healthy housing market is good for furniture demand as more consumers are buying, renting, moving, and renovating. On the other hand, periods of economic weakness or high interest rates discourage home sales and can squelch demand. In addition, home furnishing companies must contend with shifting consumer preferences such as the growing propensity to buy goods online, including big things like mattresses and sofas that were once thought to be immune from e-commerce competition.
Sales Growth
Reviewing a company’s long-term sales performance reveals insights into its quality. Any business can put up a good quarter or two, but the best consistently grow over the long haul. Over the last five years, Purple grew its sales at a weak 2.6% compounded annual growth rate. This was below our standards and is a tough starting point for our analysis.
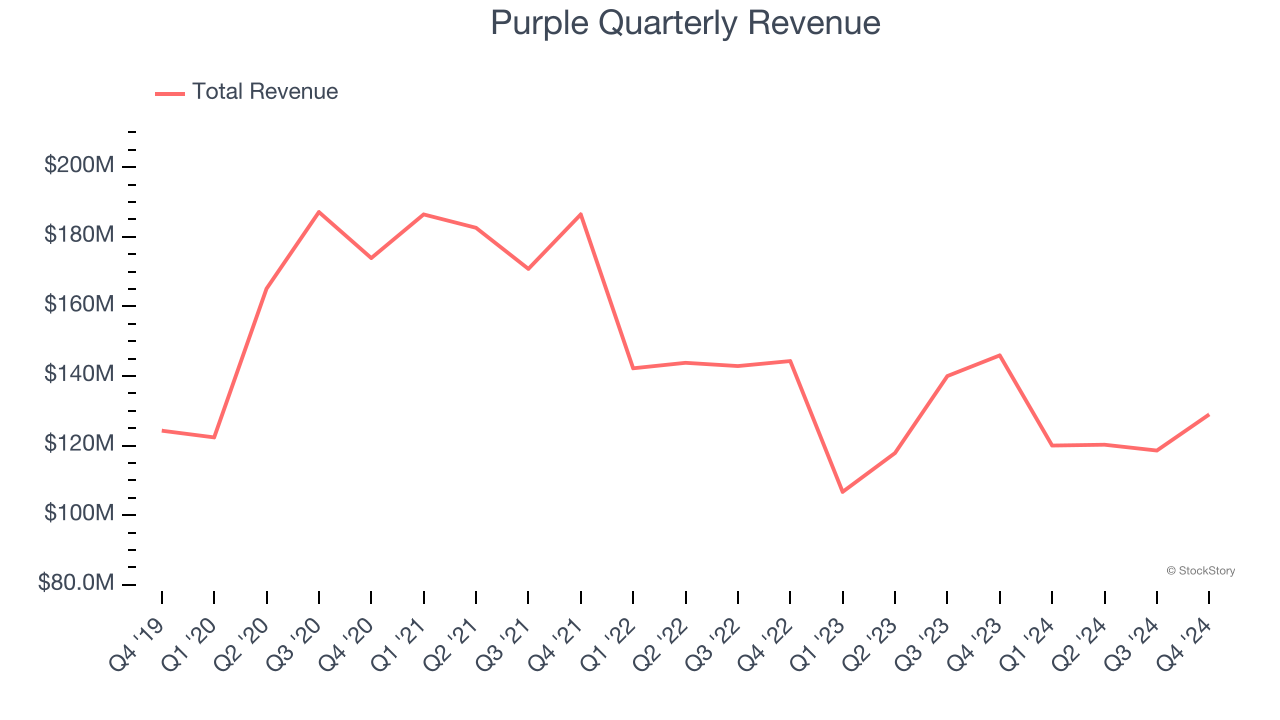
Long-term growth is the most important, but within consumer discretionary, product cycles are short and revenue can be hit-driven due to rapidly changing trends and consumer preferences. Purple’s history shows it grew in the past but relinquished its gains over the last two years, as its revenue fell by 7.7% annually. 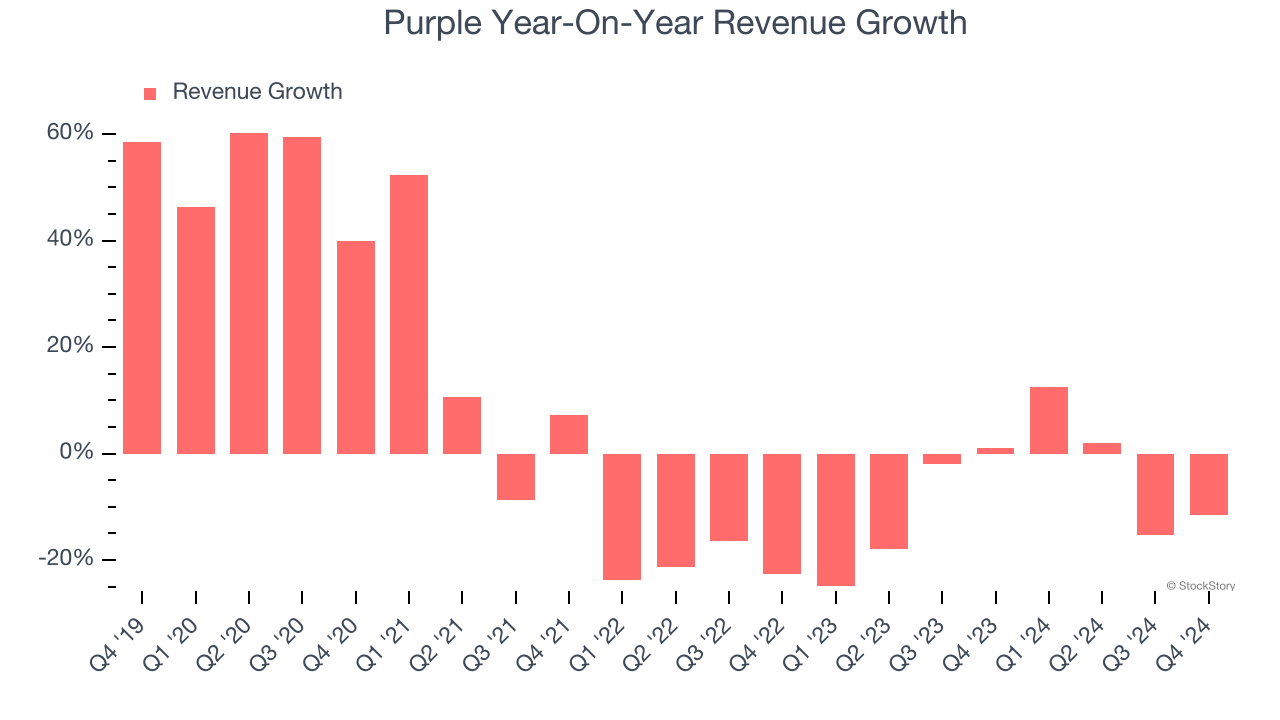
This quarter, Purple reported a rather uninspiring 11.6% year-on-year revenue decline to $129 million of revenue, in line with Wall Street’s estimates. Company management is currently guiding for a 12.9% year-on-year decline in sales next quarter.
Looking further ahead, sell-side analysts expect revenue to grow 2.3% over the next 12 months. While this projection indicates its newer products and services will spur better top-line performance, it is still below the sector average.
Unless you’ve been living under a rock, it should be obvious by now that generative AI is going to have a huge impact on how large corporations do business. While Nvidia and AMD are trading close to all-time highs, we prefer a lesser-known (but still profitable) stock benefiting from the rise of AI. Click here to access our free report one of our favorites growth stories.
Operating Margin
Operating margin is an important measure of profitability as it shows the portion of revenue left after accounting for all core expenses – everything from the cost of goods sold to advertising and wages. It’s also useful for comparing profitability across companies with different levels of debt and tax rates because it excludes interest and taxes.
Purple’s operating margin has risen over the last 12 months, but it still averaged negative 20.6% over the last two years. This is due to its large expense base and inefficient cost structure.
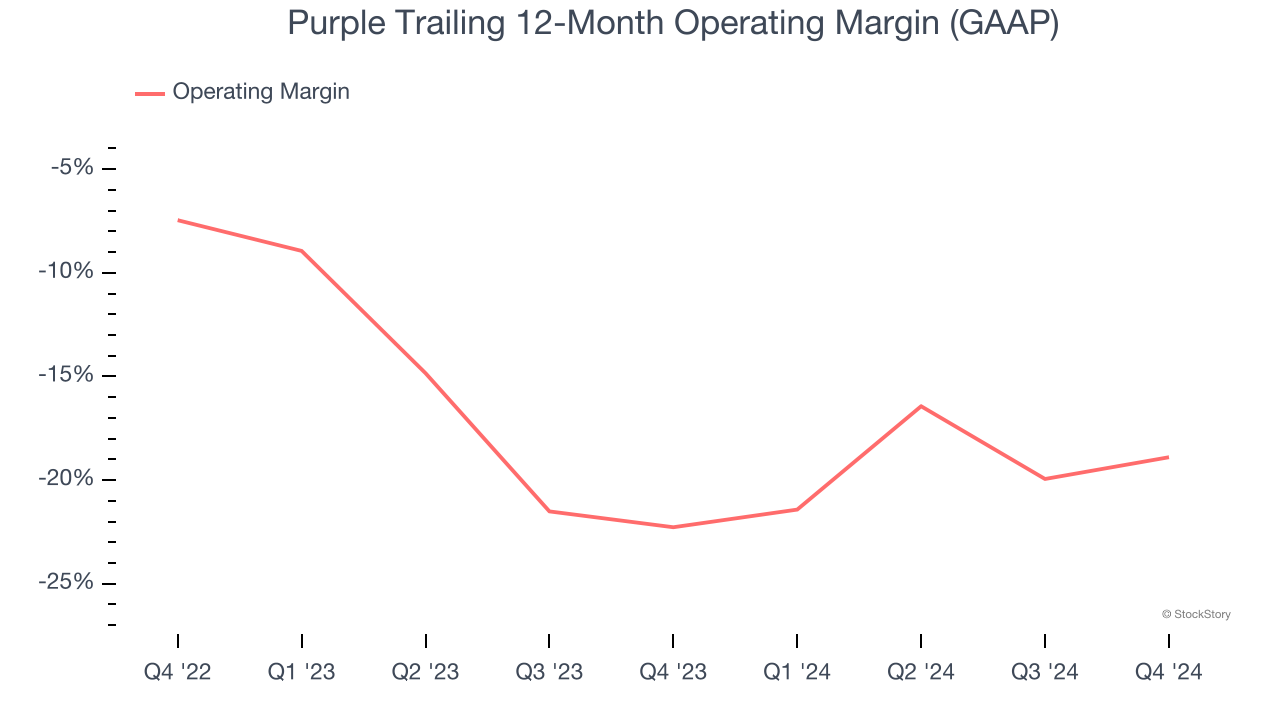
Purple’s operating margin was negative 6% this quarter. The company's consistent lack of profits raise a flag.
Earnings Per Share
We track the long-term change in earnings per share (EPS) for the same reason as long-term revenue growth. Compared to revenue, however, EPS highlights whether a company’s growth is profitable.
Sadly for Purple, its EPS declined by 18.2% annually over the last five years while its revenue grew by 2.6%. This tells us the company became less profitable on a per-share basis as it expanded.
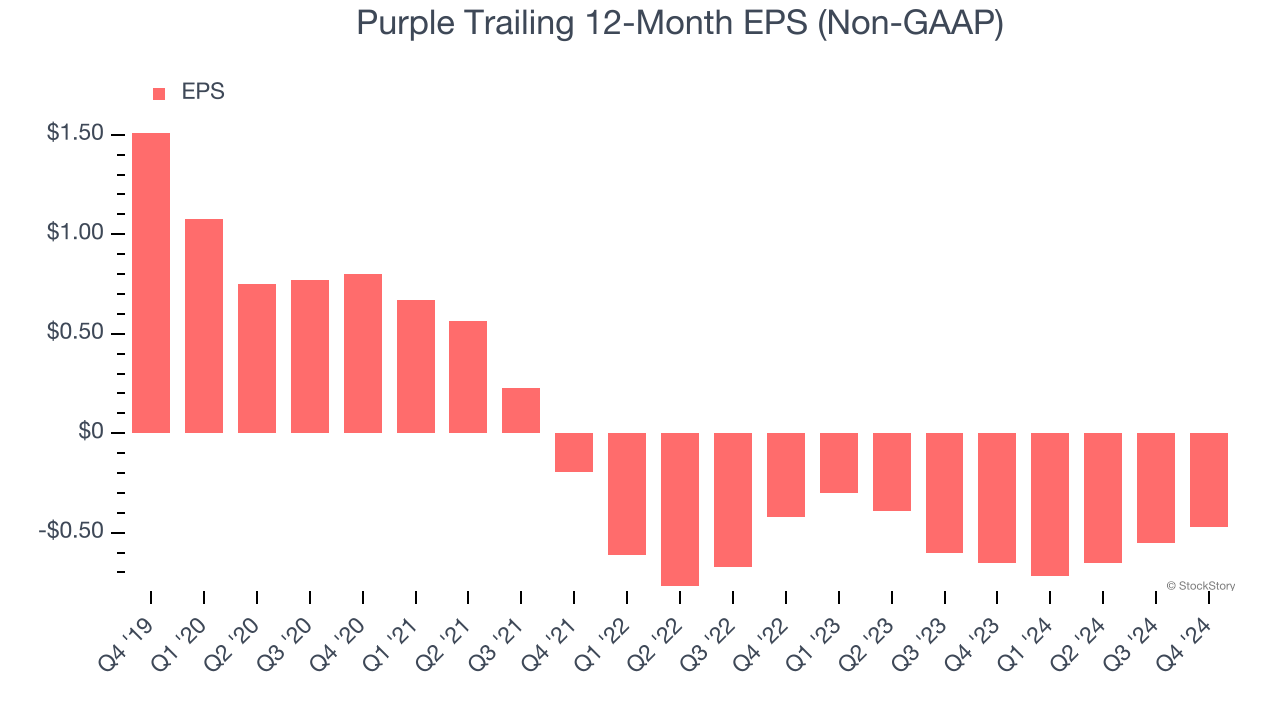
In Q4, Purple reported EPS at negative $0.07, up from negative $0.15 in the same quarter last year. This print easily cleared analysts’ estimates, and shareholders should be content with the results. Over the next 12 months, Wall Street is optimistic. Analysts forecast Purple’s full-year EPS of negative $0.47 will reach break even.
Key Takeaways from Purple’s Q4 Results
We were impressed by how significantly Purple blew past analysts’ EBITDA expectations this quarter. We were also glad its full-year EBITDA guidance trumped Wall Street’s estimates. On the other hand, its full-year revenue guidance missed. Overall, this was a weaker quarter, but the expected EBITDA profits for 2025 are boosting shares. The stock traded up 20.9% to $0.80 immediately after reporting.
Is Purple an attractive investment opportunity at the current price? The latest quarter does matter, but not nearly as much as longer-term fundamentals and valuation, when deciding if the stock is a buy. We cover that in our actionable full research report which you can read here, it’s free.