
Even during a down period for the markets, Compass has gone against the grain, climbing to $8.75. Its shares have yielded a 36.5% return over the last six months, beating the S&P 500 by 37.8%. This was partly thanks to its solid quarterly results, and the run-up might have investors contemplating their next move.
Is now the time to buy Compass, or should you be careful about including it in your portfolio? Get the full breakdown from our expert analysts, it’s free.
We’re happy investors have made money, but we're cautious about Compass. Here are three reasons why there are better opportunities than COMP and a stock we'd rather own.
Why Is Compass Not Exciting?
Fueled by its mission to replace the "paper-driven, antiquated workflow" of buying a house, Compass (NYSE: COMP) is a digital-first company operating a residential real estate brokerage in the United States.
1. Revenue Tumbling Downwards
Long-term growth is the most important, but within consumer discretionary, product cycles are short and revenue can be hit-driven due to rapidly changing trends and consumer preferences. Compass’s recent history marks a sharp pivot from its five-year trend as its revenue has shown annualized declines of 3.3% over the last two years. 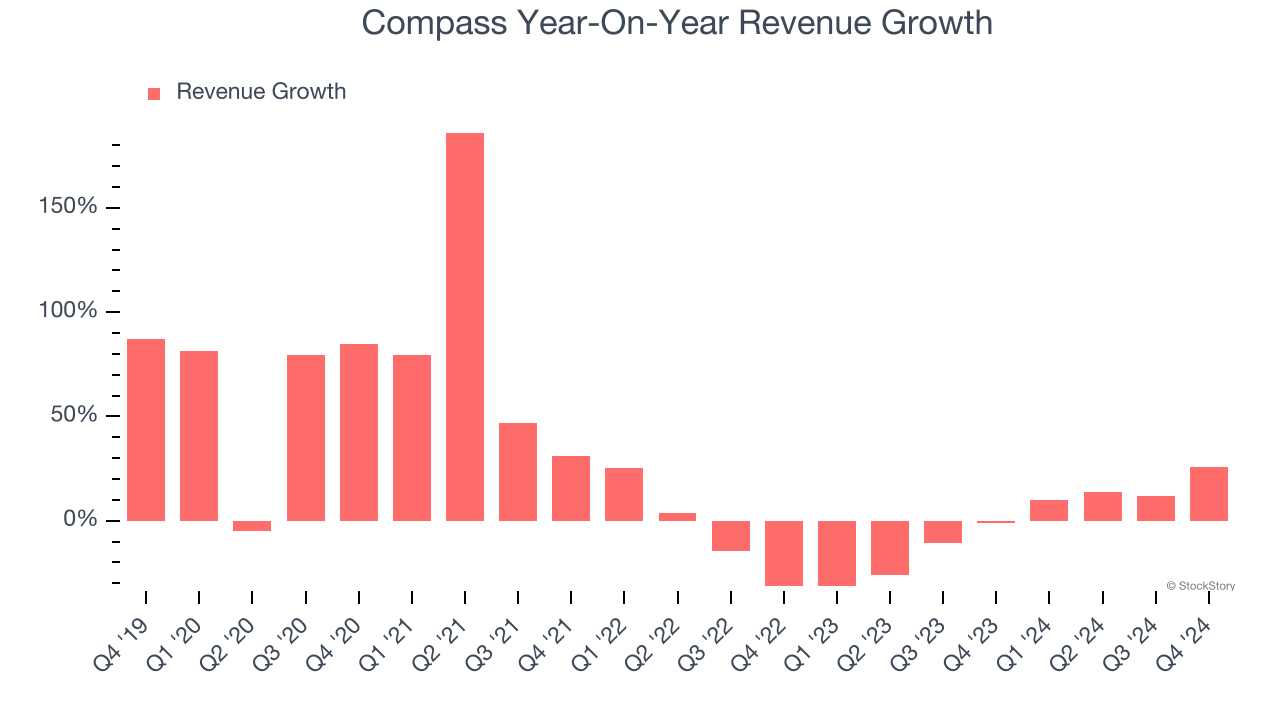
2. Inability to Grow Transactions Points to Weak Demand
Revenue growth can be broken down into changes in price and volume (for companies like Compass, our preferred volume metric is transactions). While both are important, the latter is the most critical to analyze because prices have a ceiling.
Over the last two years, Compass failed to grow its transactions, which came in at 50,411 in the latest quarter. This performance was underwhelming and implies there may be increasing competition or market saturation. It also suggests Compass might have to lower prices or invest in product improvements to accelerate growth, factors that can hinder near-term profitability. 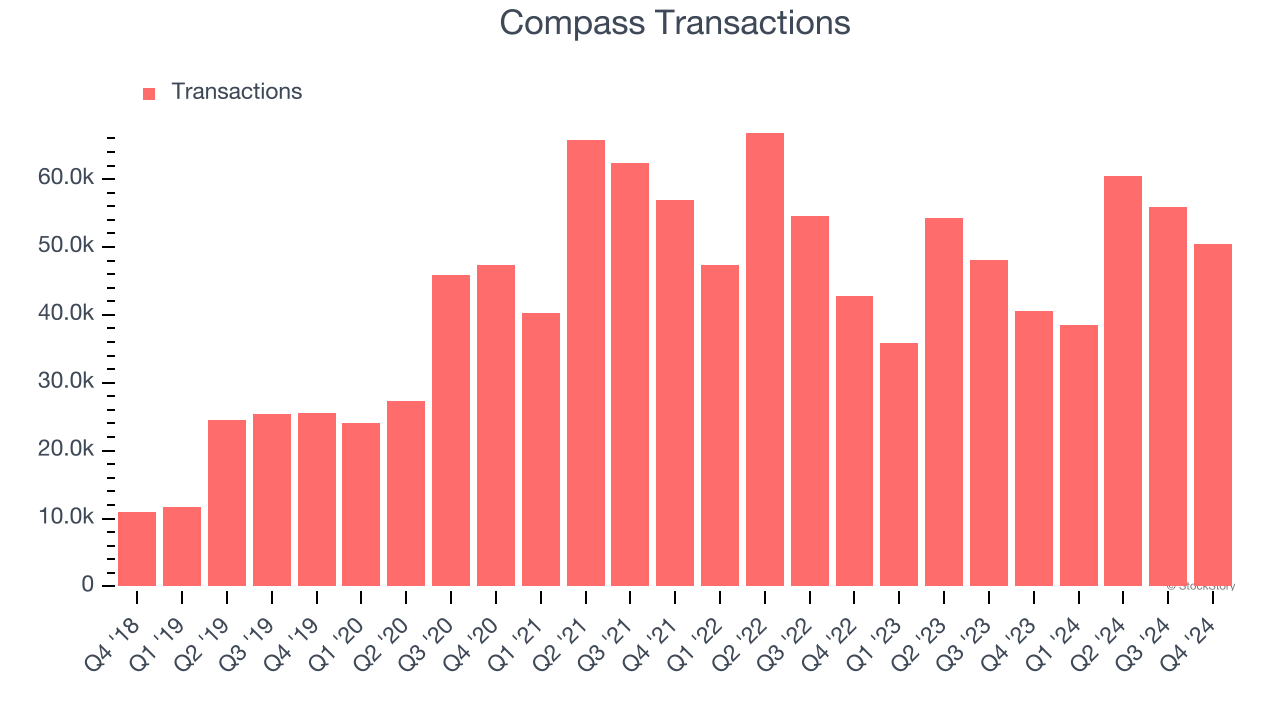
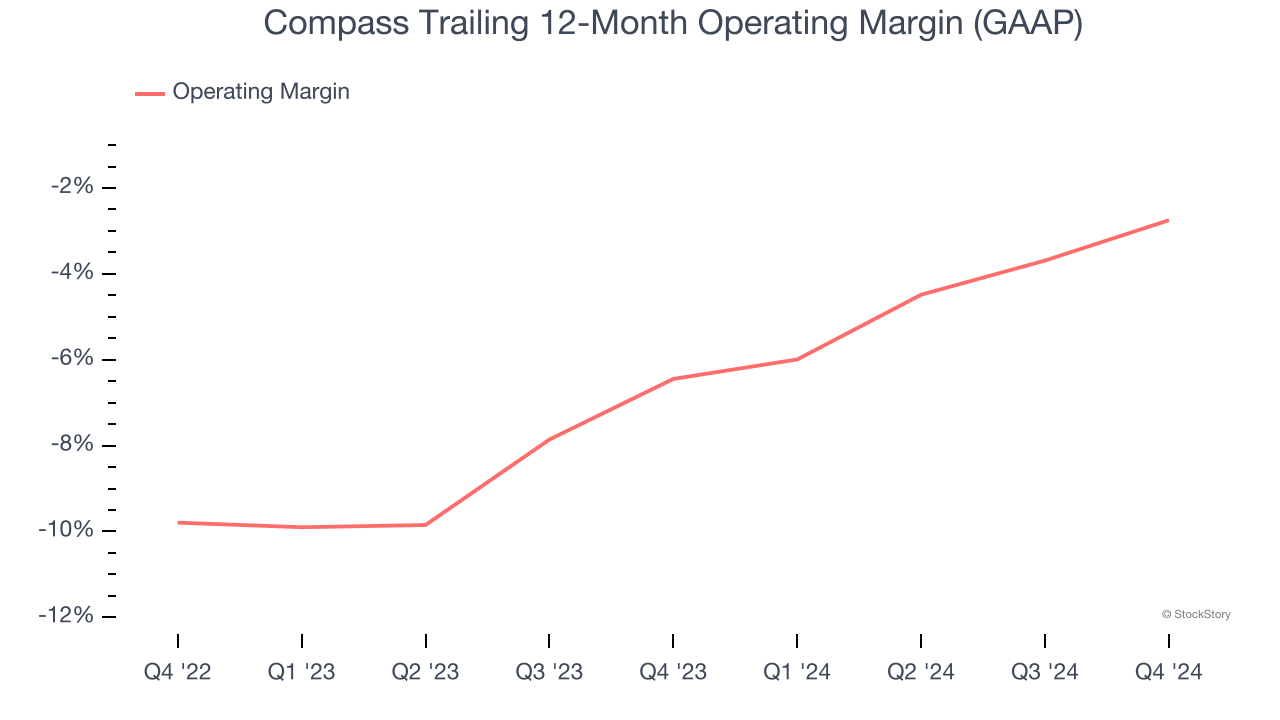
3. Operating Losses Sound the Alarms
Operating margin is a key measure of profitability. Think of it as net income - the bottom line - excluding the impact of taxes and interest on debt, which are less connected to business fundamentals.
Compass’s operating margin has risen over the last 12 months, but it still averaged negative 4.5% over the last two years. This is due to its large expense base and inefficient cost structure.
Final Judgment
Compass’s business quality ultimately falls short of our standards. With its shares topping the market in recent months, the stock trades at 67.5× forward price-to-earnings (or $8.75 per share). This valuation tells us it’s a bit of a market darling with a lot of good news priced in - you can find better investment opportunities elsewhere. We’d suggest looking at one of our top digital advertising picks.
Stocks We Would Buy Instead of Compass
The elections are now behind us. With rates dropping and inflation cooling, many analysts expect a breakout market - and we’re zeroing in on the stocks that could benefit immensely.
Take advantage of the rebound by checking out our Top 9 Market-Beating Stocks. This is a curated list of our High Quality stocks that have generated a market-beating return of 175% over the last five years.
Stocks that made our list in 2019 include now familiar names such as Nvidia (+2,183% between December 2019 and December 2024) as well as under-the-radar businesses like Sterling Infrastructure (+1,096% five-year return). Find your next big winner with StockStory today for free.