
Over the past six months, CTS’s shares (currently trading at $41.45) have posted a disappointing 10.9% loss while the S&P 500 was down 1.2%. This was partly due to its softer quarterly results and might have investors contemplating their next move.
Is there a buying opportunity in CTS, or does it present a risk to your portfolio? Check out our in-depth research report to see what our analysts have to say, it’s free.
Even with the cheaper entry price, we're swiping left on CTS for now. Here are three reasons why CTS doesn't excite us and a stock we'd rather own.
Why Do We Think CTS Will Underperform?
With roots dating back to 1896 and a focus on critical electronic functions, CTS Corporation (NYSE: CTS) designs and manufactures sensors, connectivity components, and actuators for aerospace, defense, industrial, medical, and transportation markets.
1. Long-Term Revenue Growth Disappoints
Examining a company’s long-term performance can provide clues about its quality. Even a bad business can shine for one or two quarters, but a top-tier one grows for years. Unfortunately, CTS’s 1.9% annualized revenue growth over the last five years was sluggish. This fell short of our benchmarks. 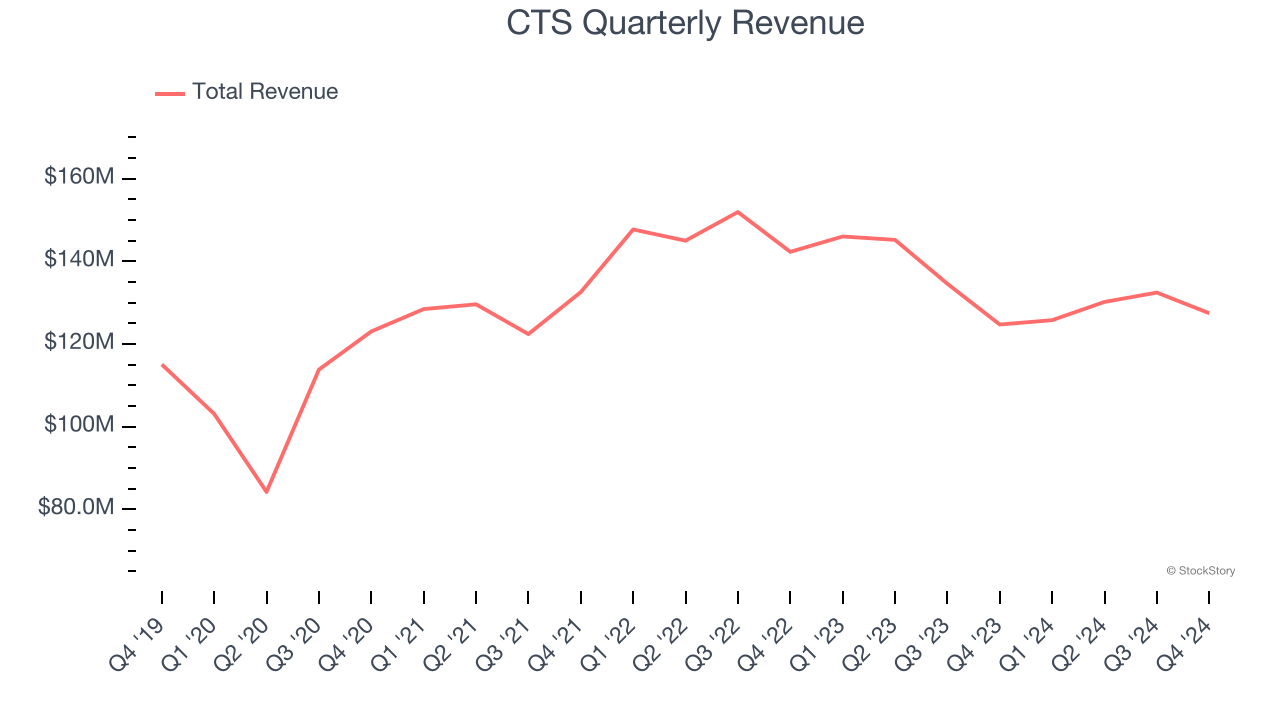
2. Fewer Distribution Channels Limit its Ceiling
With $515.8 million in revenue over the past 12 months, CTS is a small player in the business services space, which sometimes brings disadvantages compared to larger competitors benefiting from economies of scale and numerous distribution channels.
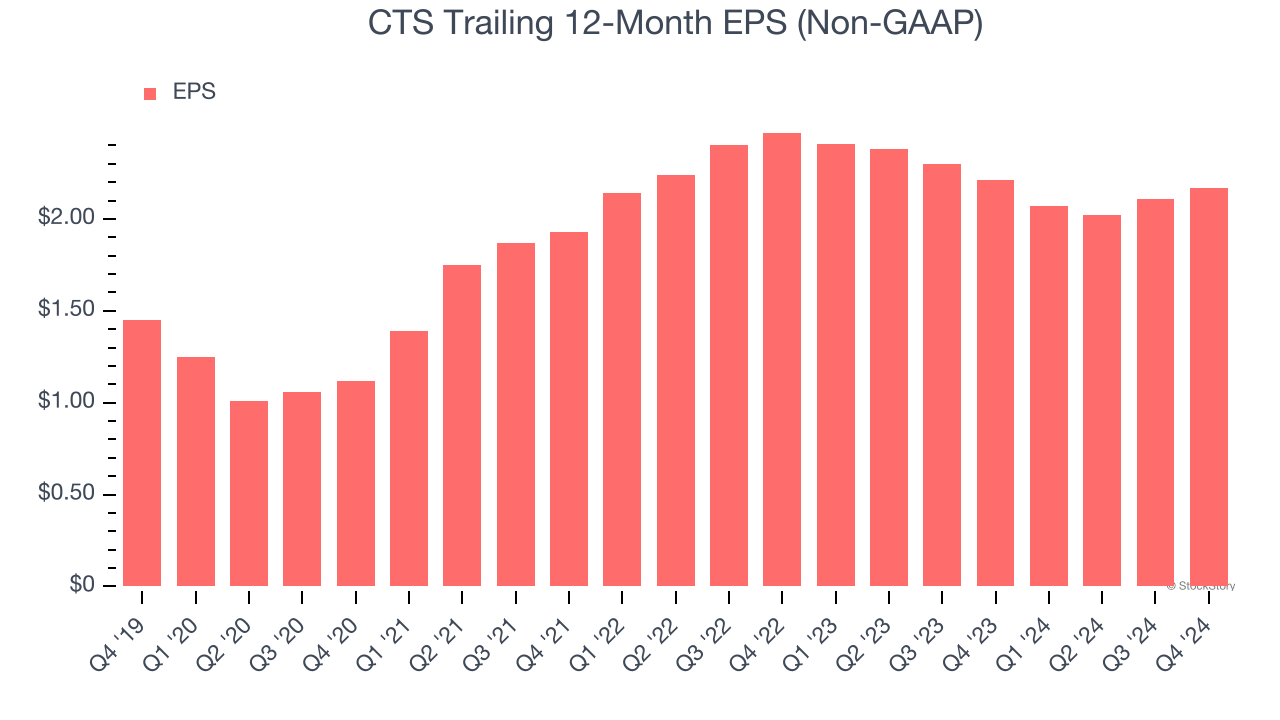
3. EPS Took a Dip Over the Last Two Years
While long-term earnings trends give us the big picture, we also track EPS over a shorter period because it can provide insight into an emerging theme or development for the business.
Sadly for CTS, its EPS and revenue declined by 6.3% and 6.3% annually over the last two years. We tend to steer our readers away from companies with falling revenue and EPS, where diminishing earnings could imply changing secular trends and preferences. If the tide turns unexpectedly, CTS’s low margin of safety could leave its stock price susceptible to large downswings.
Final Judgment
We cheer for all companies serving everyday consumers, but in the case of CTS, we’ll be cheering from the sidelines. After the recent drawdown, the stock trades at 17.5× forward price-to-earnings (or $41.45 per share). At this valuation, there’s a lot of good news priced in - you can find better investment opportunities elsewhere. Let us point you toward the Amazon and PayPal of Latin America.
Stocks We Like More Than CTS
The elections are now behind us. With rates dropping and inflation cooling, many analysts expect a breakout market - and we’re zeroing in on the stocks that could benefit immensely.
Take advantage of the rebound by checking out our Top 6 Stocks for this week. This is a curated list of our High Quality stocks that have generated a market-beating return of 175% over the last five years.
Stocks that made our list in 2019 include now familiar names such as Nvidia (+2,183% between December 2019 and December 2024) as well as under-the-radar businesses like Sterling Infrastructure (+1,096% five-year return). Find your next big winner with StockStory today for free.


