LSI currently trades at $17.32 and has been a dream stock for shareholders. It’s returned 485% since March 2020, blowing past the S&P 500’s 122% gain. The company has also beaten the index over the past six months as its stock price is up 11.6% thanks to its solid quarterly results.
Is there a buying opportunity in LSI, or does it present a risk to your portfolio? Get the full breakdown from our expert analysts, it’s free.
We’re happy investors have made money, but we're swiping left on LSI for now. Here are three reasons why there are better opportunities than LYTS and a stock we'd rather own.
Why Is LSI Not Exciting?
Enhancing commercial environments, LSI (NASDAQ: LYTS) provides lighting and display solutions for businesses and retailers.
1. Lackluster Revenue Growth
We at StockStory place the most emphasis on long-term growth, but within industrials, a stretched historical view may miss cycles, industry trends, or a company capitalizing on catalysts such as a new contract win or a successful product line. LSI’s recent history shows its demand has slowed as its annualized revenue growth of 3% over the last two years was below its five-year trend. 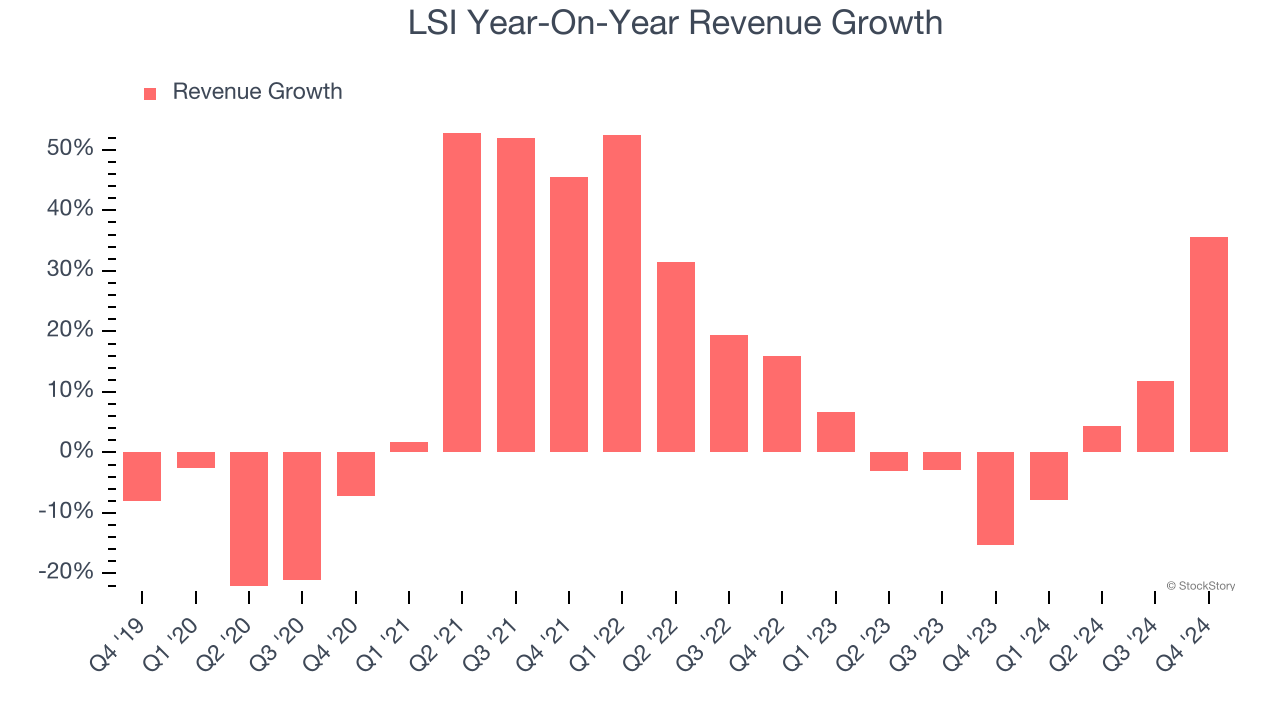
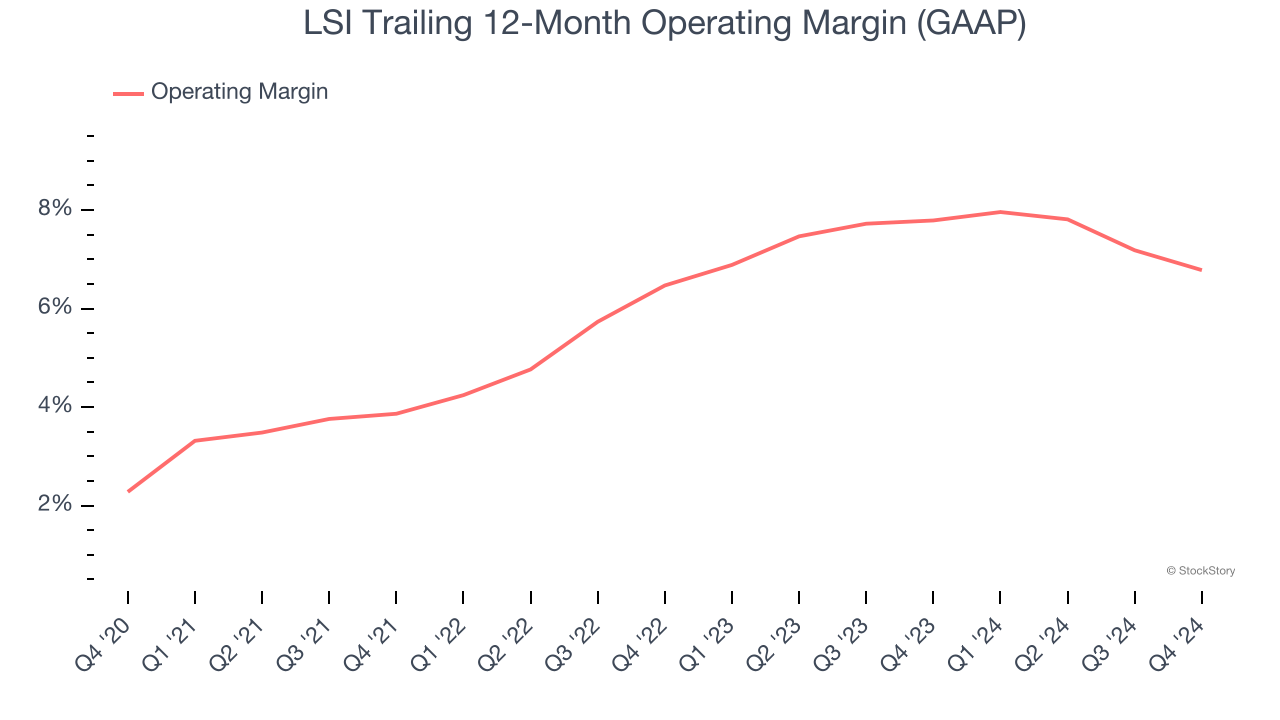
2. Weak Operating Margin Could Cause Trouble
Operating margin is one of the best measures of profitability because it tells us how much money a company takes home after procuring and manufacturing its products, marketing and selling those products, and most importantly, keeping them relevant through research and development.
LSI was profitable over the last five years but held back by its large cost base. Its average operating margin of 5.8% was weak for an industrials business. This result isn’t too surprising given its low gross margin as a starting point.
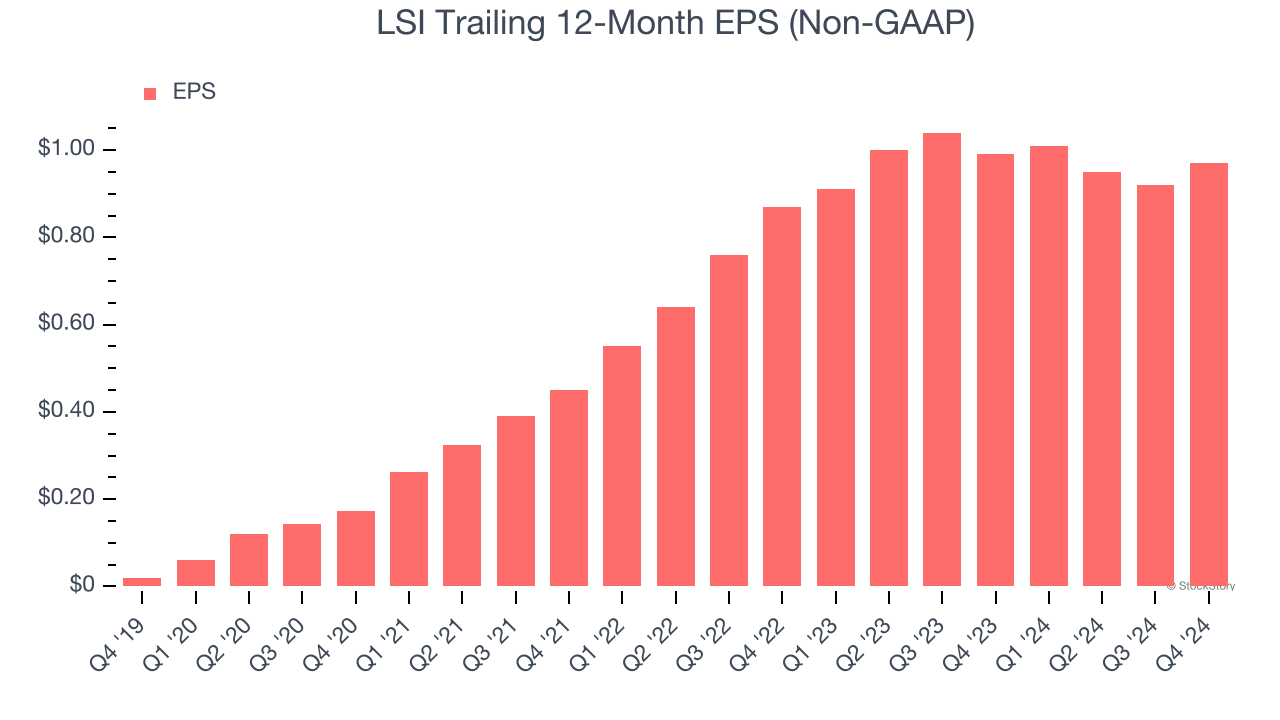
3. Recent EPS Growth Below Our Standards
While long-term earnings trends give us the big picture, we also track EPS over a shorter period because it can provide insight into an emerging theme or development for the business.
LSI’s EPS grew at an unimpressive 5.6% compounded annual growth rate over the last two years. On the bright side, this performance was higher than its 3% annualized revenue growth and tells us the company became more profitable on a per-share basis as it expanded.
Final Judgment
LSI isn’t a terrible business, but it isn’t one of our picks. With its shares beating the market recently, the stock trades at 15× forward price-to-earnings (or $17.32 per share). This valuation is reasonable, but the company’s shakier fundamentals present too much downside risk. We're pretty confident there are more exciting stocks to buy at the moment. We’d recommend looking at one of our top software and edge computing picks.
Stocks We Like More Than LSI
The elections are now behind us. With rates dropping and inflation cooling, many analysts expect a breakout market - and we’re zeroing in on the stocks that could benefit immensely.
Take advantage of the rebound by checking out our Top 6 Stocks for this week. This is a curated list of our High Quality stocks that have generated a market-beating return of 175% over the last five years.
Stocks that made our list in 2019 include now familiar names such as Nvidia (+2,183% between December 2019 and December 2024) as well as under-the-radar businesses like Sterling Infrastructure (+1,096% five-year return). Find your next big winner with StockStory today for free.