
Quarterly earnings results are a good time to check in on a company’s progress, especially compared to its peers in the same sector. Today we are looking at Ford (NYSE: F) and the best and worst performers in the automobile manufacturing industry.
Much capital investment and technical know-how are needed to manufacture functional, safe, and aesthetically pleasing automobiles for the mass market. Barriers to entry are therefore high, and auto manufacturers with economies of scale can boast strong economic moats. However, this doesn’t insulate them from new entrants, as electric vehicles (EVs) have entered the market and are upending it. This has forced established manufacturers to not only contend with emerging EV-first competitors but also decide how much they want to invest in these disruptive technologies, which will likely cannibalize their legacy offerings.
The 7 automobile manufacturing stocks we track reported a satisfactory Q4. As a group, revenues beat analysts’ consensus estimates by 5%.
Amidst this news, share prices of the companies have had a rough stretch. On average, they are down 19.8% since the latest earnings results.
Best Q4: Ford (NYSE: F)
Established to make automobiles accessible to a broader segment of the population, Ford (NYSE: F) designs, manufactures, and sells a variety of automobiles, trucks, and electric vehicles.
Ford reported revenues of $48.21 billion, up 4.9% year on year. This print exceeded analysts’ expectations by 5.5%. Overall, it was a stunning quarter for the company with a solid beat of analysts’ sales volume and EBITDA estimates.
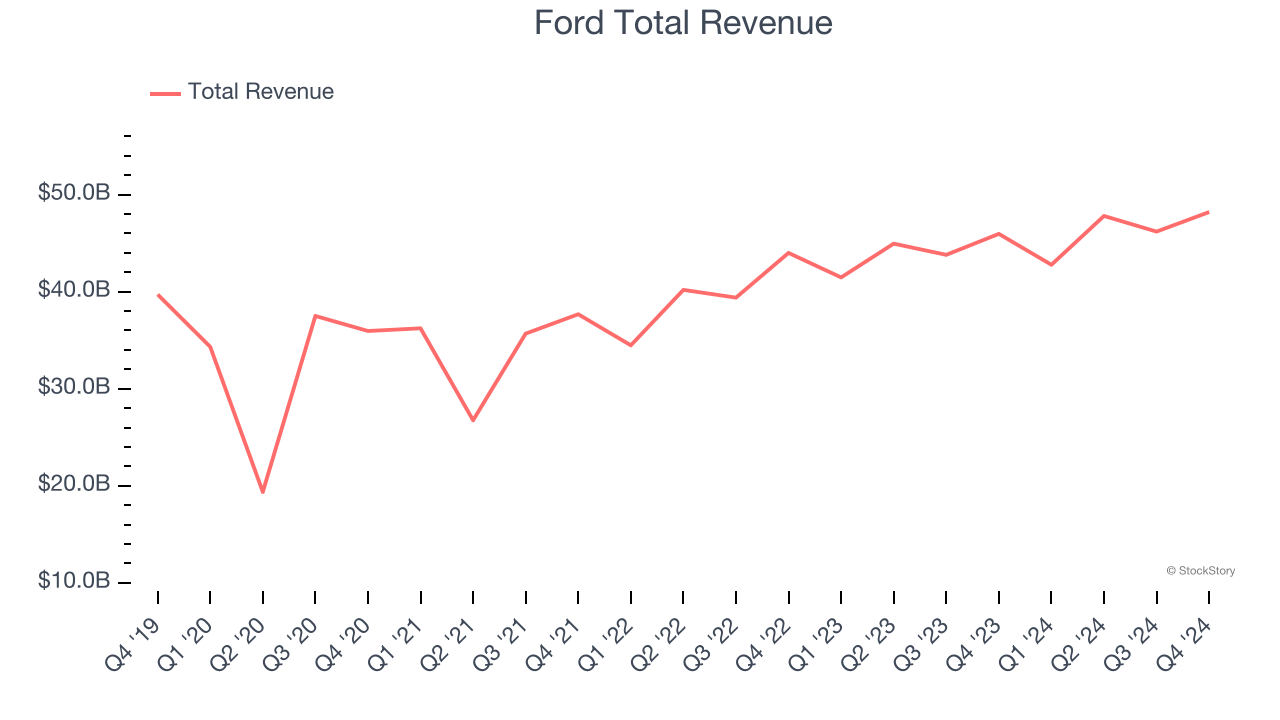
The stock is down 2.7% since reporting and currently trades at $9.73.
Is now the time to buy Ford? Access our full analysis of the earnings results here, it’s free.
Rivian (NASDAQ: RIVN)
The manufacturer of Amazon’s delivery trucks, Rivian (NASDAQ: RIVN) designs, manufactures, and sells electric vehicles and commercial delivery vans.
Rivian reported revenues of $1.73 billion, up 31.9% year on year, outperforming analysts’ expectations by 22.4%. The business had an exceptional quarter with a solid beat of analysts’ EPS estimates and an impressive beat of analysts’ EBITDA estimates.
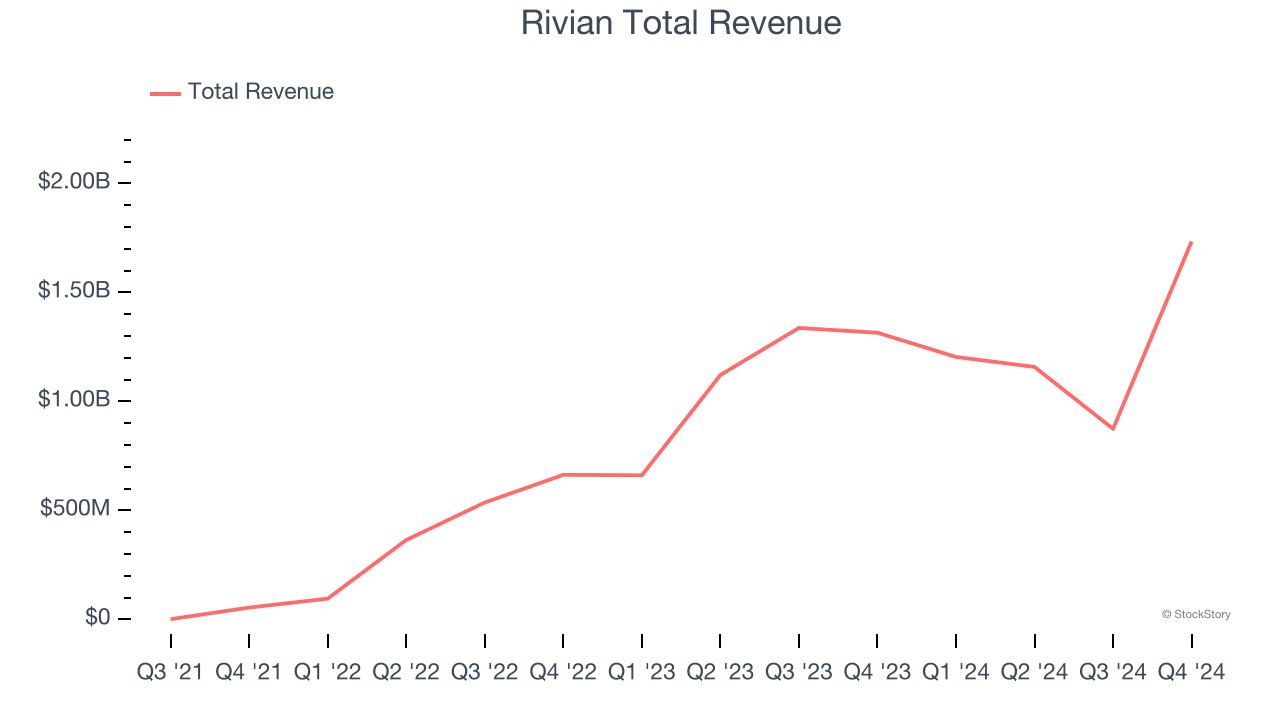
Rivian delivered the biggest analyst estimates beat among its peers. Although it had a fine quarter compared to its peers, the market seems unhappy with the results as the stock is down 21.1% since reporting. It currently trades at $10.72.
Is now the time to buy Rivian? Access our full analysis of the earnings results here, it’s free.
Slowest Q4: Tesla (NASDAQ: TSLA)
Originally founded by Martin Eberhard and Marc Tarpenning in 2003, Tesla (NASDAQ: TSLA) is an electric vehicle company accelerating the world’s transition to sustainable energy.
Tesla reported revenues of $25.71 billion, up 2.1% year on year, falling short of analysts’ expectations by 6%. It was a disappointing quarter as it posted a significant miss of analysts’ operating income and EPS estimates.
As expected, the stock is down 36.7% since the results and currently trades at $245.60.
Read our full analysis of Tesla’s results here.
Lucid (NASDAQ: LCID)
Founded by a former Tesla Vice President, Lucid Group (NASDAQ: LCID) designs, manufactures, and sells luxury electric vehicles with long-range capabilities.
Lucid reported revenues of $234.5 million, up 49.2% year on year. This number topped analysts’ expectations by 10.8%. It was an exceptional quarter as it also put up an impressive beat of analysts’ sales volume and EPS estimates.
Lucid scored the fastest revenue growth among its peers. The stock is down 18.4% since reporting and currently trades at $2.13.
Read our full, actionable report on Lucid here, it’s free.
Winnebago (NYSE: WGO)
Created to provide high-quality, affordable RVs to the post-war American family, Winnebago (NYSE: WGO) is a manufacturer of recreational vehicles, providing a range of motorhomes, travel trailers, and fifth-wheel products for outdoor and adventure lifestyles.
Winnebago reported revenues of $625.6 million, down 18% year on year. This result came in 6.9% below analysts' expectations. Overall, it was a slower quarter as it also logged a miss of analysts’ Motorhomes revenue estimates and a significant miss of analysts’ adjusted operating income estimates.
Winnebago had the weakest performance against analyst estimates and slowest revenue growth among its peers. The stock is down 30.9% since reporting and currently trades at $35.89.
Read our full, actionable report on Winnebago here, it’s free.
Want to invest in winners with rock-solid fundamentals? Check out our 9 Best Market-Beating Stocks and add them to your watchlist. These companies are poised for growth regardless of the political or macroeconomic climate.
Join Paid Stock Investor Research
Help us make StockStory more helpful to investors like yourself. Join our paid user research session and receive a $50 Amazon gift card for your opinions. Sign up here.