
Shareholders of Frontdoor would probably like to forget the past six months even happened. The stock dropped 22.6% and now trades at $37.50. This may have investors wondering how to approach the situation.
Is there a buying opportunity in Frontdoor, or does it present a risk to your portfolio? Check out our in-depth research report to see what our analysts have to say, it’s free.
Even though the stock has become cheaper, we don't have much confidence in Frontdoor. Here are three reasons why you should be careful with FTDR and a stock we'd rather own.
Why Is Frontdoor Not Exciting?
Established in 2018 as a spin-off from ServiceMaster Global Holdings, Frontdoor (NASDAQ: FTDR) is a provider of home warranty and service plans.
1. Decline in Home Service Plans Points to Weak Demand
Revenue growth can be broken down into changes in price and volume (for companies like Frontdoor, our preferred volume metric is home service plans). While both are important, the latter is the most critical to analyze because prices have a ceiling.
Frontdoor’s home service plans came in at 2.12 million in the latest quarter, and over the last two years, averaged 3.9% year-on-year declines. This performance was underwhelming and implies there may be increasing competition or market saturation. It also suggests Frontdoor might have to lower prices or invest in product improvements to grow, factors that can hinder near-term profitability. 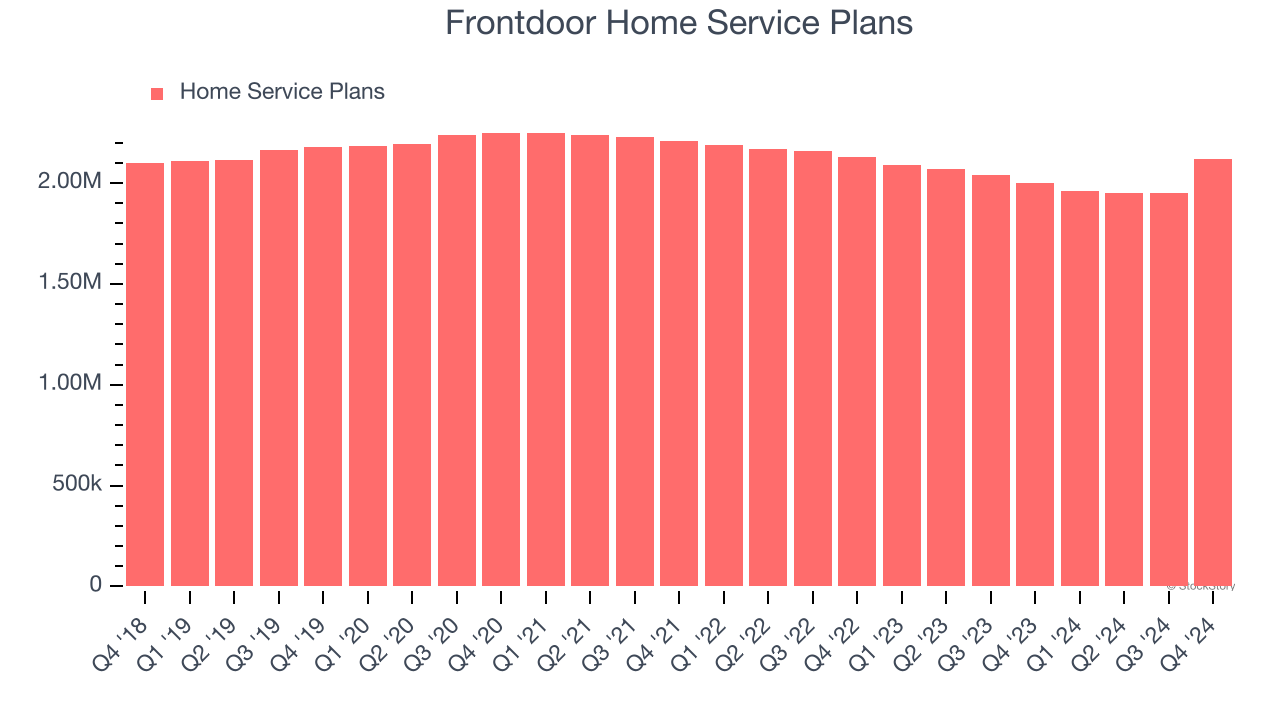
2. Projected Revenue Growth Is Slim
Forecasted revenues by Wall Street analysts signal a company’s potential. Predictions may not always be accurate, but accelerating growth typically boosts valuation multiples and stock prices while slowing growth does the opposite.
Over the next 12 months, sell-side analysts expect Frontdoor’s revenue to rise by 9.9%. While this projection suggests its newer products and services will spur better top-line performance, it is still below average for the sector.
3. Cash Flow Margin Set to Decline
Free cash flow isn't a prominently featured metric in company financials and earnings releases, but we think it's telling because it accounts for all operating and capital expenses, making it tough to manipulate. Cash is king.
Over the next year, analysts predict Frontdoor’s cash conversion will slightly fall. Their consensus estimates imply its free cash flow margin of 12.5% for the last 12 months will decrease to 11.2%.
Final Judgment
Frontdoor’s business quality ultimately falls short of our standards. Following the recent decline, the stock trades at 11.9× forward price-to-earnings (or $37.50 per share). This valuation is reasonable, but the company’s shakier fundamentals present too much downside risk. We're pretty confident there are superior stocks to buy right now. We’d recommend looking at the Amazon and PayPal of Latin America.
Stocks We Like More Than Frontdoor
The Trump trade may have passed, but rates are still dropping and inflation is still cooling. Opportunities are ripe for those ready to act - and we’re here to help you pick them.
Get started by checking out our Top 5 Growth Stocks for this month. This is a curated list of our High Quality stocks that have generated a market-beating return of 175% over the last five years.
Stocks that made our list in 2019 include now familiar names such as Nvidia (+2,183% between December 2019 and December 2024) as well as under-the-radar businesses like Comfort Systems (+751% five-year return). Find your next big winner with StockStory today for free.


