Over the last six months, Allegion’s shares have sunk to $128.65, producing a disappointing 8.4% loss while the S&P 500 was flat. This might have investors contemplating their next move.
Is there a buying opportunity in Allegion, or does it present a risk to your portfolio? Get the full stock story straight from our expert analysts, it’s free.
Despite the more favorable entry price, we don't have much confidence in Allegion. Here are three reasons why you should be careful with ALLE and a stock we'd rather own.
Why Is Allegion Not Exciting?
Allegion plc (NYSE: ALLE) is a provider of security products and solutions that keep people and assets safe and secure in various environments.
1. Slow Organic Growth Suggests Waning Demand In Core Business
Investors interested in Electrical Systems companies should track organic revenue in addition to reported revenue. This metric gives visibility into Allegion’s core business because it excludes one-time events such as mergers, acquisitions, and divestitures along with foreign currency fluctuations - non-fundamental factors that can manipulate the income statement.
Over the last two years, Allegion’s organic revenue averaged 3.9% year-on-year growth. This performance was underwhelming and suggests it may need to improve its products, pricing, or go-to-market strategy, which can add an extra layer of complexity to its operations. 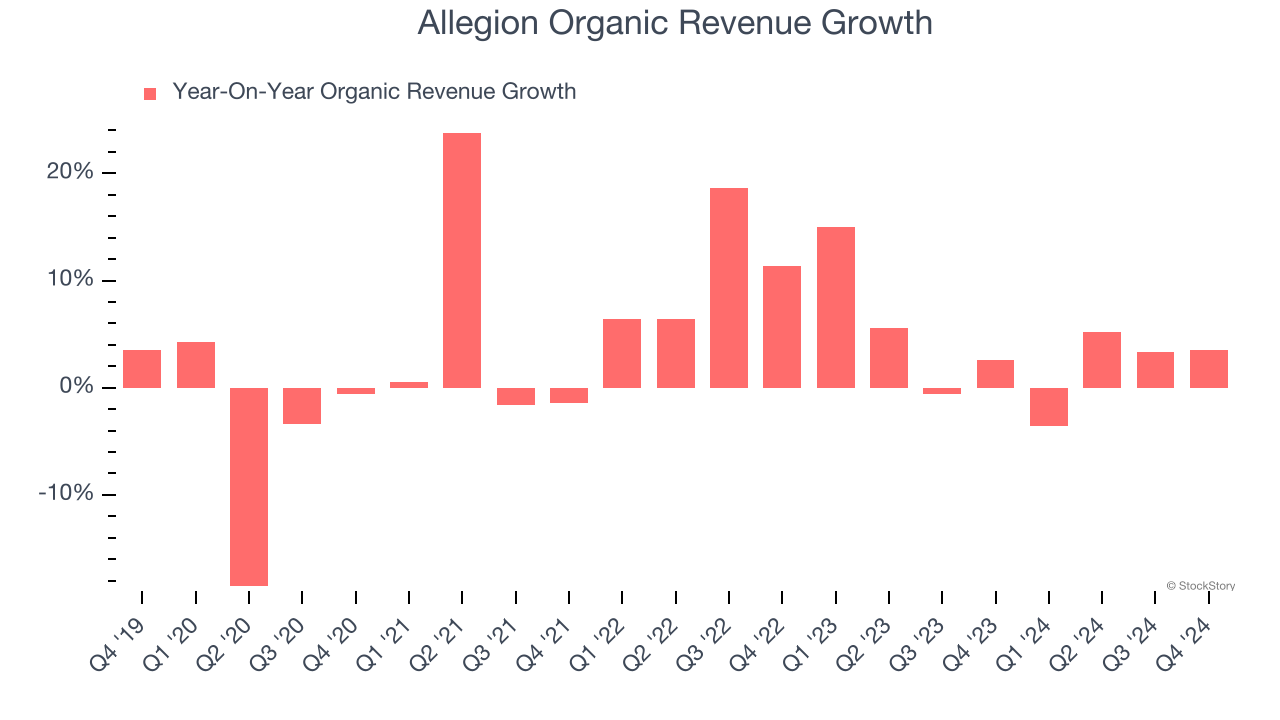
2. Projected Revenue Growth Is Slim
Forecasted revenues by Wall Street analysts signal a company’s potential. Predictions may not always be accurate, but accelerating growth typically boosts valuation multiples and stock prices while slowing growth does the opposite.
Over the next 12 months, sell-side analysts expect Allegion’s revenue to rise by 2.5%, a deceleration versus its 7.4% annualized growth for the past two years. This projection doesn't excite us and suggests its products and services will see some demand headwinds.
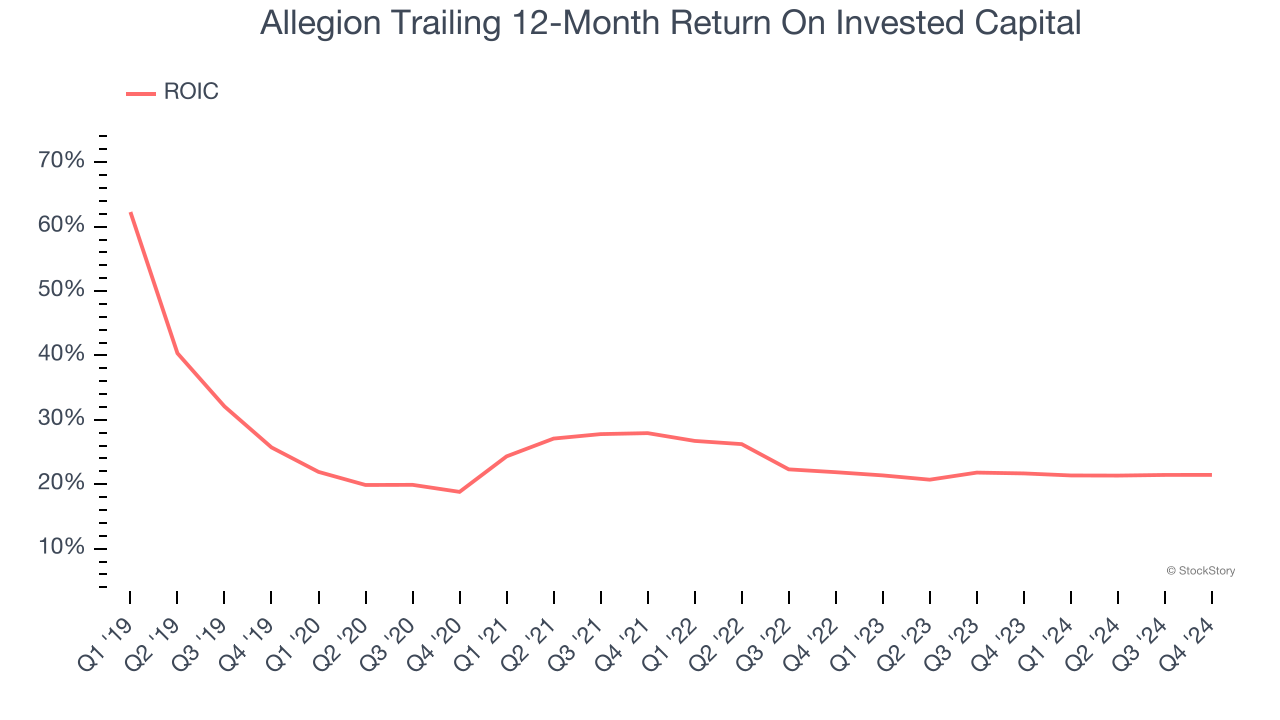
3. New Investments Fail to Bear Fruit as ROIC Declines
ROIC, or return on invested capital, is a metric showing how much operating profit a company generates relative to the money it has raised (debt and equity).
We like to invest in businesses with high returns, but the trend in a company’s ROIC is what often surprises the market and moves the stock price. Over the last few years, Allegion’s ROIC averaged 1.8 percentage point decreases each year. We like what management has done in the past, but its declining returns are perhaps a symptom of fewer profitable growth opportunities.
Final Judgment
Allegion isn’t a terrible business, but it doesn’t pass our bar. After the recent drawdown, the stock trades at 16.6× forward price-to-earnings (or $128.65 per share). Beauty is in the eye of the beholder, but our analysis shows the upside isn’t great compared to the potential downside. We're fairly confident there are better investments elsewhere. Let us point you toward a fast-growing restaurant franchise with an A+ ranch dressing sauce.
Stocks We Like More Than Allegion
With rates dropping, inflation stabilizing, and the elections in the rearview mirror, all signs point to the start of a new bull run - and we’re laser-focused on finding the best stocks for this upcoming cycle.
Put yourself in the driver’s seat by checking out our Top 5 Strong Momentum Stocks for this week. This is a curated list of our High Quality stocks that have generated a market-beating return of 175% over the last five years.
Stocks that made our list in 2019 include now familiar names such as Nvidia (+2,183% between December 2019 and December 2024) as well as under-the-radar businesses like Sterling Infrastructure (+1,096% five-year return). Find your next big winner with StockStory today for free.