Footwear company Caleres (NYSE: CAL) missed Wall Street’s revenue expectations in Q4 CY2024, with sales falling 8.3% year on year to $639.2 million. Next quarter’s revenue guidance of $622.9 million underwhelmed, coming in 4.5% below analysts’ estimates. Its GAAP profit of $0.15 per share was 68.7% below analysts’ consensus estimates.
Is now the time to buy Caleres? Find out by accessing our full research report, it’s free.
Caleres (CAL) Q4 CY2024 Highlights:
- Revenue: $639.2 million vs analyst estimates of $646 million (8.3% year-on-year decline, 1.1% miss)
- EPS (GAAP): $0.15 vs analyst expectations of $0.48 (68.7% miss partly due to a one-time restructuring charge)
- Adjusted EBITDA: $29 million vs analyst estimates of $30.48 million (4.5% margin, 4.9% miss)
- Revenue Guidance for Q1 CY2025 is $622.9 million at the midpoint, below analyst estimates of $652.5 million
- EPS (GAAP) guidance for the upcoming financial year 2025 is $3 at the midpoint, beating analyst estimates by 11.1%
- Operating Margin: 1.2%, down from 4.4% in the same quarter last year
- Free Cash Flow Margin: 2.7%, down from 4.6% in the same quarter last year
- Market Capitalization: $551.2 million
“Our fourth quarter earnings were at the high end of our most recent guidance. We gained market share in women’s fashion footwear, our Lead Brands outperformed, and we grew our sneaker penetration. Famous Footwear’s business softened in the quarter, but we maximized key selling periods. We invested to support our long-term growth while continuing to evolve our supply chain and further mitigate the impact of additional tariffs,” said Jay Schmidt, president and chief executive officer.
Company Overview
The owner of Dr. Scholl's, Caleres (NYSE: CAL) is a footwear company offering a range of styles.
Footwear
Before the advent of the internet, styles changed, but consumers mainly bought shoes by visiting local brick-and-mortar shoe, department, and specialty stores. Today, not only do styles change more frequently as fads travel through social media and the internet but consumers are also shifting the way they buy their goods, favoring omnichannel and e-commerce experiences. Some footwear companies have made concerted efforts to adapt while those who are slower to move may fall behind.
Sales Growth
A company’s long-term sales performance can indicate its overall quality. Any business can put up a good quarter or two, but many enduring ones grow for years. Caleres’s demand was weak over the last five years as its sales fell at a 1.4% annual rate. This wasn’t a great result and is a sign of poor business quality.
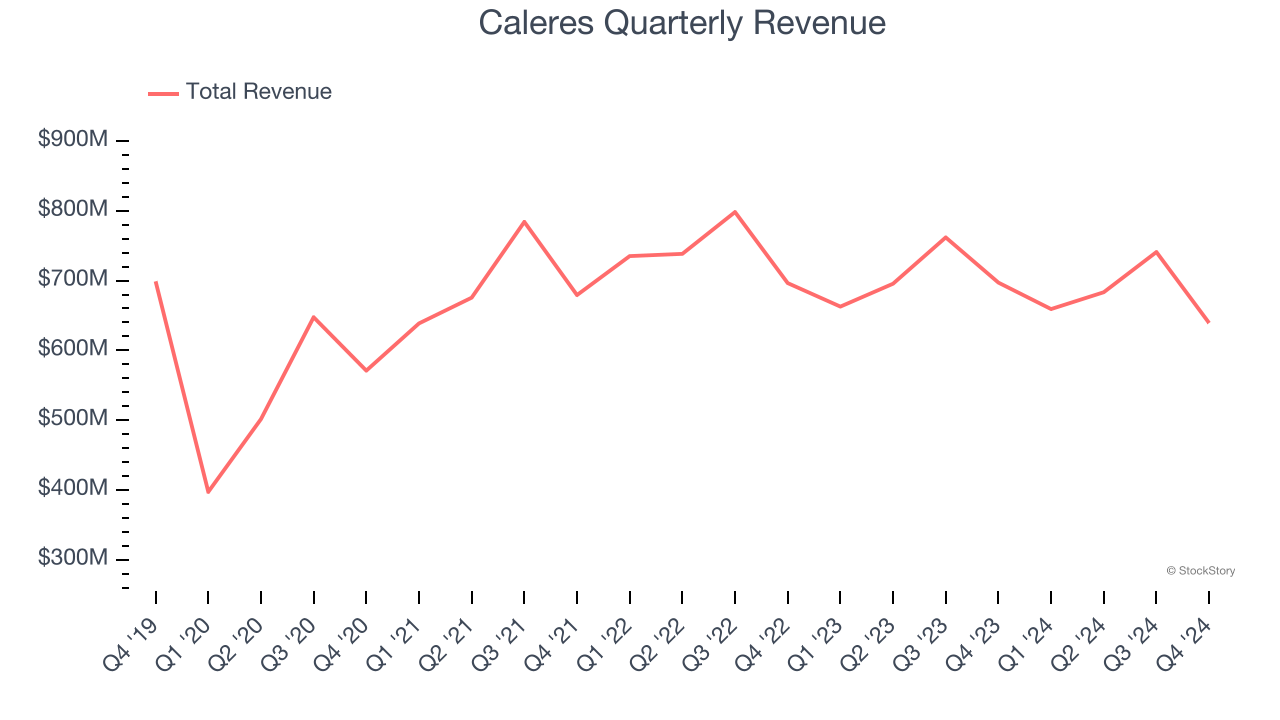
Long-term growth is the most important, but within consumer discretionary, product cycles are short and revenue can be hit-driven due to rapidly changing trends and consumer preferences. Caleres’s recent history shows its demand remained suppressed as its revenue has declined by 4.2% annually over the last two years. 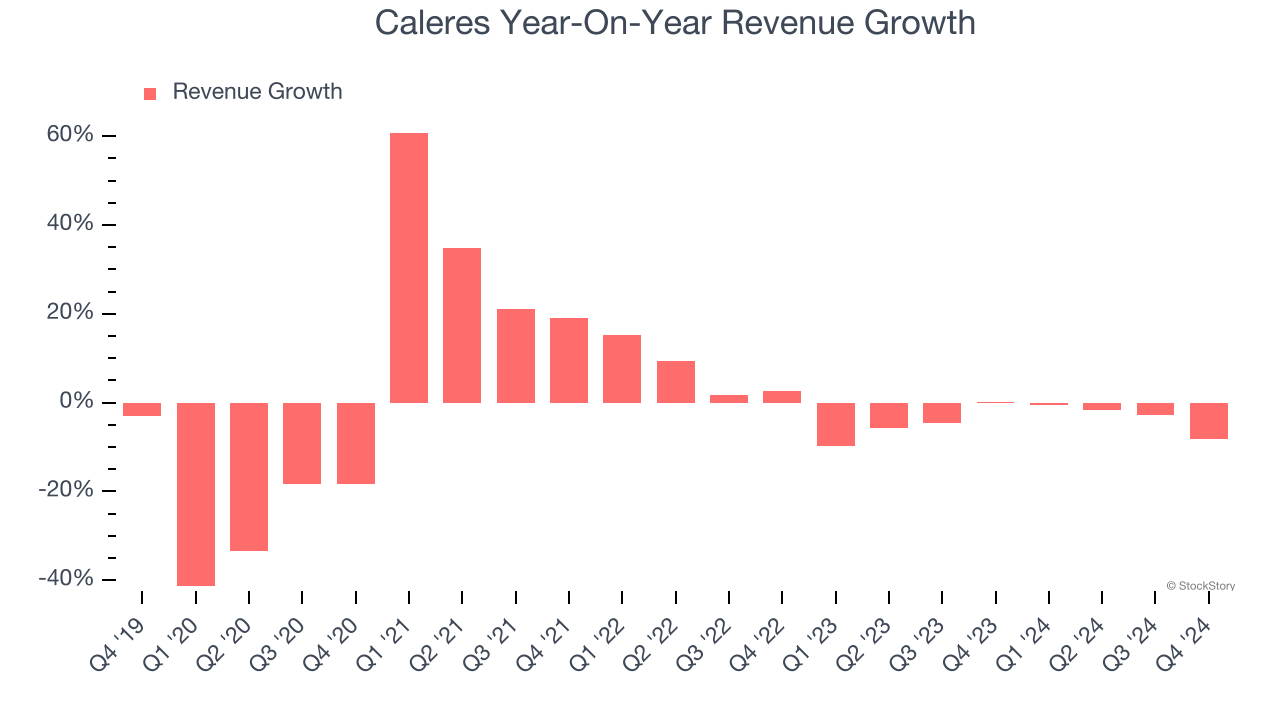
This quarter, Caleres missed Wall Street’s estimates and reported a rather uninspiring 8.3% year-on-year revenue decline, generating $639.2 million of revenue. Company management is currently guiding for a 5.5% year-on-year decline in sales next quarter.
Looking further ahead, sell-side analysts expect revenue to grow 2.2% over the next 12 months. Although this projection implies its newer products and services will catalyze better top-line performance, it is still below average for the sector.
Software is eating the world and there is virtually no industry left that has been untouched by it. That drives increasing demand for tools helping software developers do their jobs, whether it be monitoring critical cloud infrastructure, integrating audio and video functionality, or ensuring smooth content streaming. Click here to access a free report on our 3 favorite stocks to play this generational megatrend.
Operating Margin
Caleres’s operating margin has shrunk over the last 12 months and averaged 6.3% over the last two years. The company’s profitability was mediocre for a consumer discretionary business and shows it couldn’t pass its higher operating expenses onto its customers.
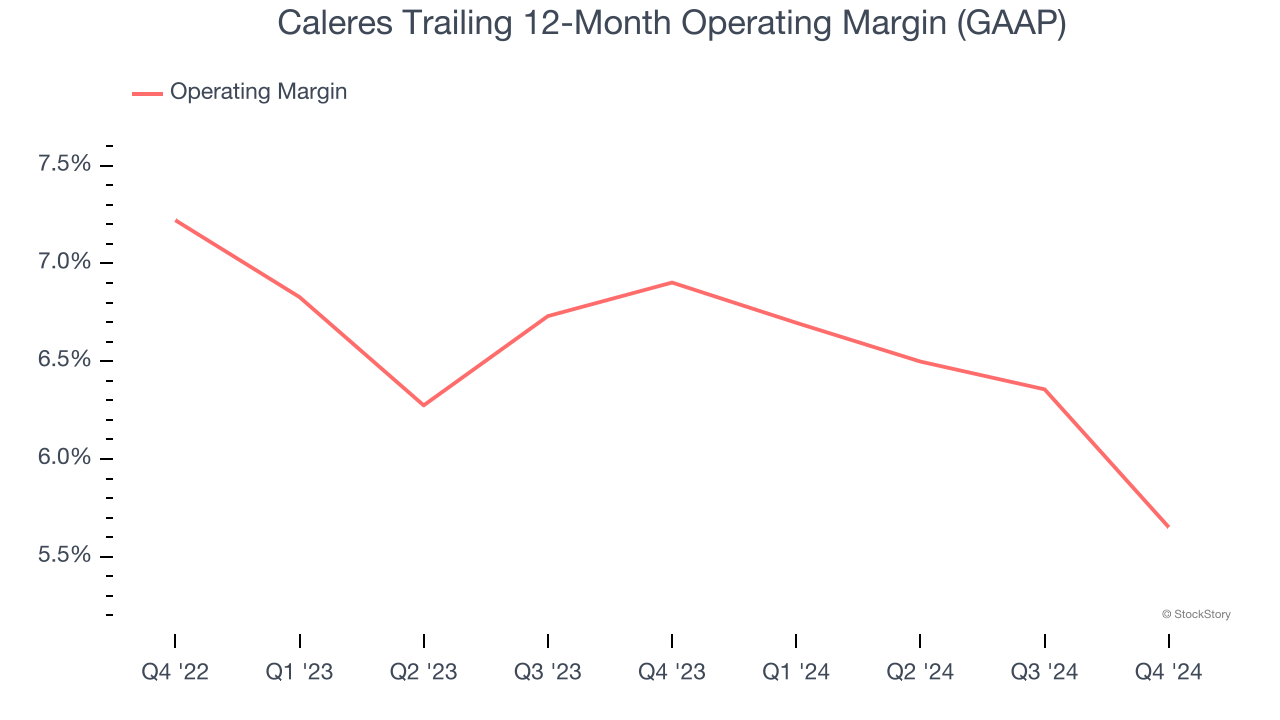
In Q4, Caleres generated an operating profit margin of 1.2%, down 3.2 percentage points year on year. This contraction shows it was less efficient because its expenses increased relative to its revenue.
Earnings Per Share
We track the long-term change in earnings per share (EPS) for the same reason as long-term revenue growth. Compared to revenue, however, EPS highlights whether a company’s growth is profitable.
Caleres’s EPS grew at a solid 14.5% compounded annual growth rate over the last five years, higher than its 1.4% annualized revenue declines. However, this alone doesn’t tell us much about its business quality because its operating margin didn’t expand.
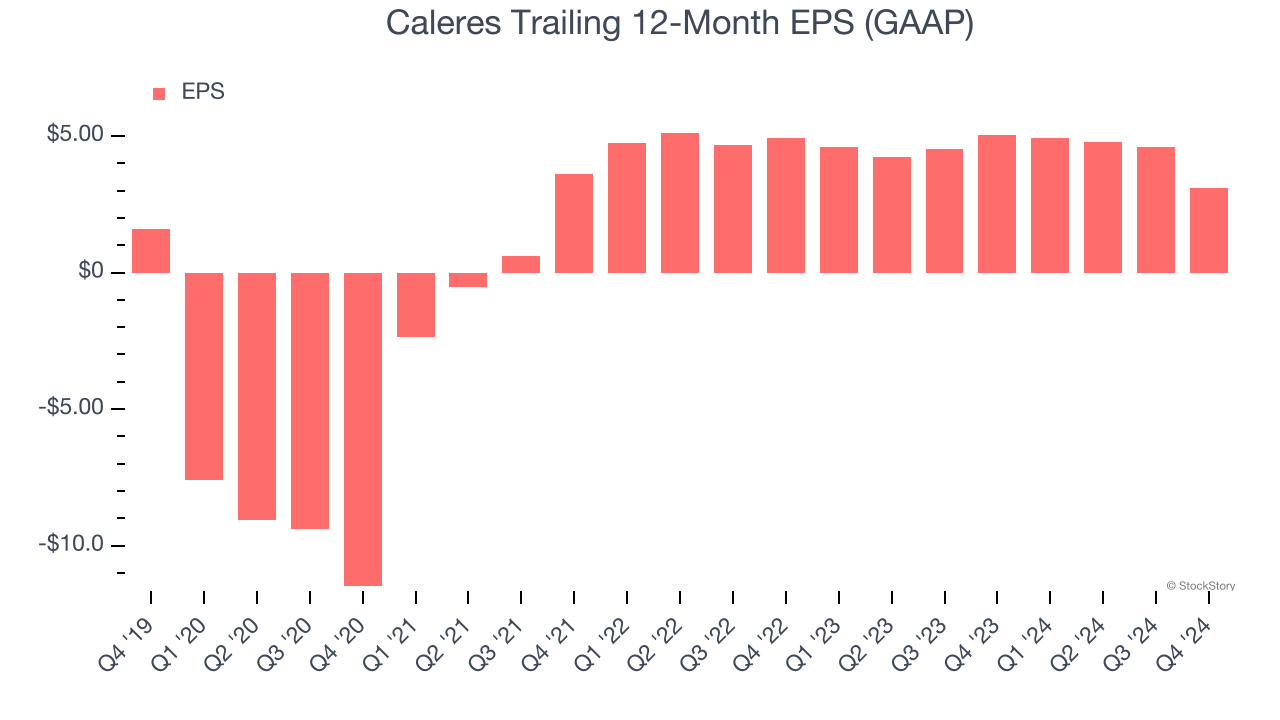
In Q4, Caleres reported EPS at $0.15, down from $1.64 in the same quarter last year. This print missed analysts’ estimates, but we care more about long-term EPS growth than short-term movements. Over the next 12 months, Wall Street expects Caleres’s full-year EPS of $3.10 to shrink by 12.7%.
Key Takeaways from Caleres’s Q4 Results
We were impressed by Caleres’s optimistic full-year EPS guidance, which beat analysts’ expectations. On the other hand, its EPS missed significantly and its EPS guidance for next quarter fell short of Wall Street’s estimates. Overall, this was a softer quarter. The stock remained flat at $16.44 immediately after reporting.
Is Caleres an attractive investment opportunity right now? If you’re making that decision, you should consider the bigger picture of valuation, business qualities, as well as the latest earnings. We cover that in our actionable full research report which you can read here, it’s free.