Earnings results often indicate what direction a company will take in the months ahead. With Q4 behind us, let’s have a look at Malibu Boats (NASDAQ: MBUU) and its peers.
Leisure products cover a wide range of goods in the consumer discretionary sector. Maintaining a strong brand is key to success, and those who differentiate themselves will enjoy customer loyalty and pricing power while those who don’t may find themselves in precarious positions due to the non-essential nature of their offerings.
The 13 leisure products stocks we track reported a mixed Q4. As a group, revenues beat analysts’ consensus estimates by 1.7% while next quarter’s revenue guidance was 1.9% below.
Amidst this news, share prices of the companies have had a rough stretch. On average, they are down 10.9% since the latest earnings results.
Best Q4: Malibu Boats (NASDAQ: MBUU)
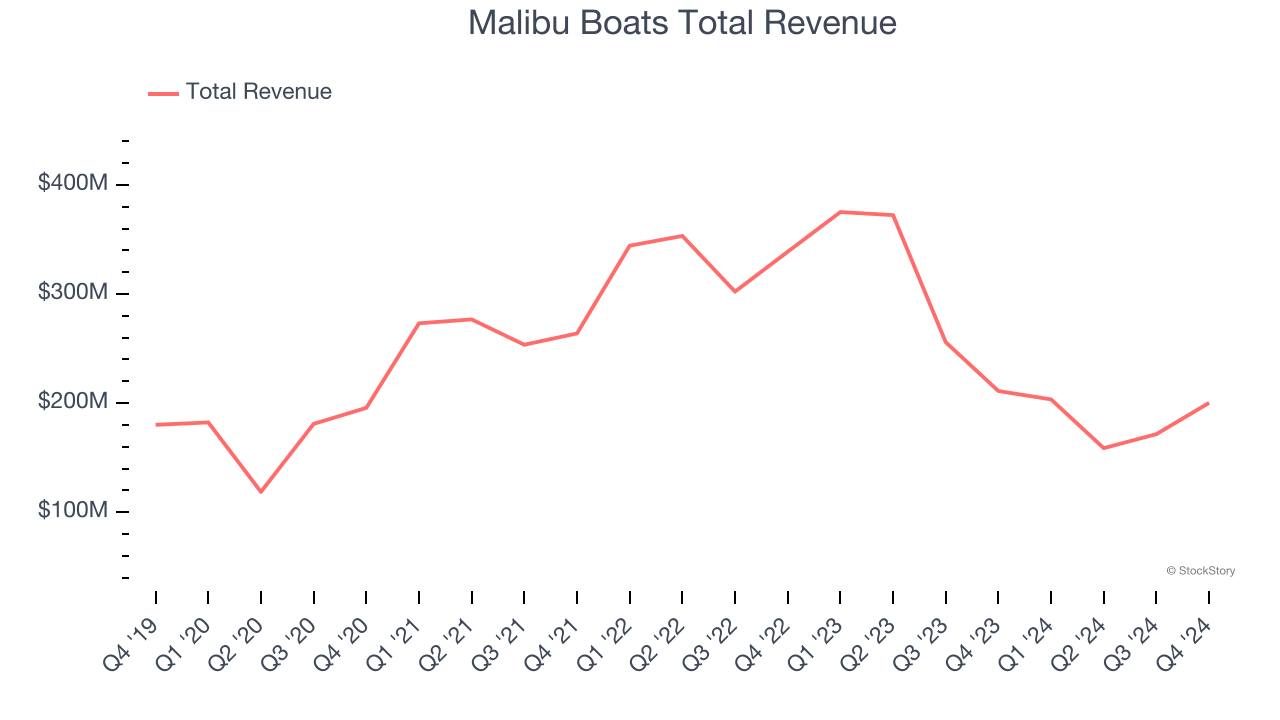
Founded in California in 1982, Malibu Boats (NASDAQ: MBUU) is a manufacturer of high-performance sports boats and luxury watercrafts.
Malibu Boats reported revenues of $200.3 million, down 5.1% year on year. This print exceeded analysts’ expectations by 4.8%. Overall, it was an exceptional quarter for the company with a solid beat of analysts’ EPS estimates and an impressive beat of analysts’ adjusted operating income estimates.
"During the second quarter, we navigated a challenging marine environment by leveraging our strong brand portfolio of industry-leading innovation while maintaining an unwavering focus on dealer health," commented Steve Menneto, Chief Executive Officer of Malibu Boats,
The stock is down 20.8% since reporting and currently trades at $30.40.
Is now the time to buy Malibu Boats? Access our full analysis of the earnings results here, it’s free.
American Outdoor Brands (NASDAQ: AOUT)
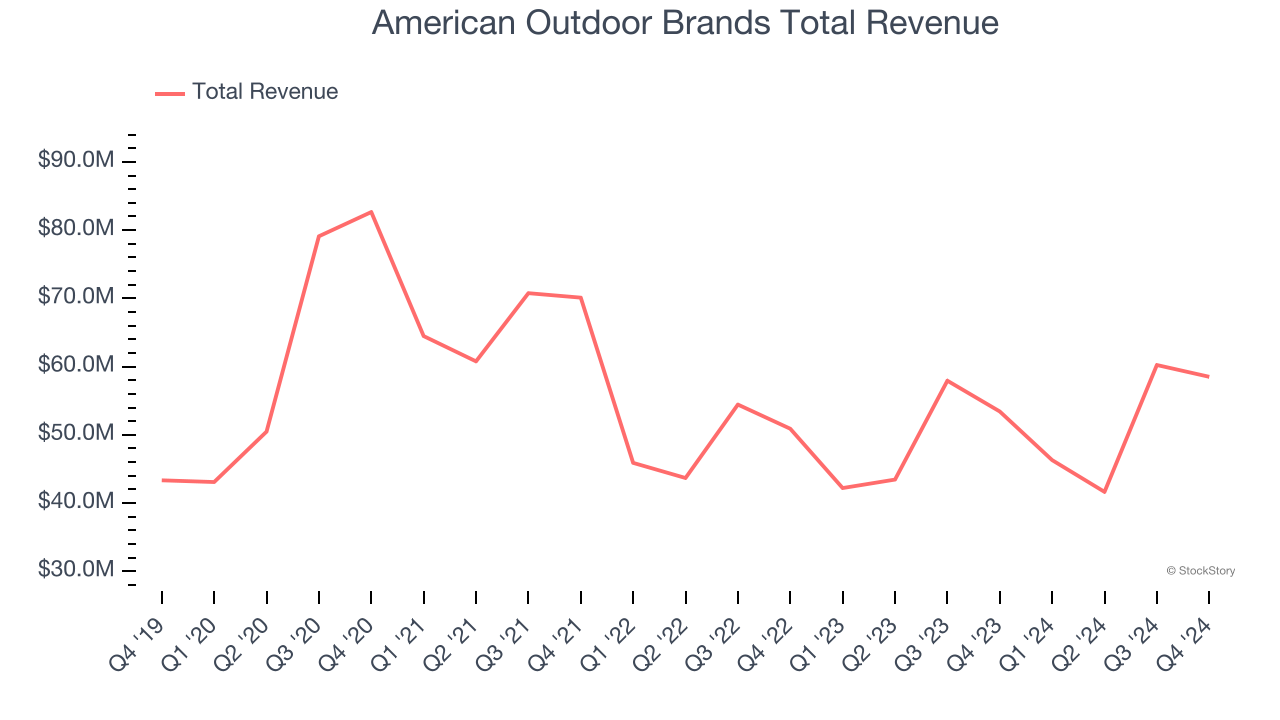
Spun off from Smith and Wesson in 2020, American Outdoor Brands (NASDAQ: AOUT) is an outdoor and recreational products company that offers firearms and firearm accessories.
American Outdoor Brands reported revenues of $58.51 million, up 9.5% year on year, outperforming analysts’ expectations by 4%. The business had a very strong quarter with a solid beat of analysts’ EPS estimates and an impressive beat of analysts’ EBITDA estimates.
Although it had a fine quarter compared to its peers, the market seems unhappy with the results as the stock is down 12.7% since reporting. It currently trades at $13.13.
Is now the time to buy American Outdoor Brands? Access our full analysis of the earnings results here, it’s free.
Weakest Q4: Harley-Davidson (NYSE: HOG)
Founded in 1903, Harley-Davidson (NYSE: HOG) is an American motorcycle manufacturer known for its heavyweight motorcycles designed for cruising on highways.
Harley-Davidson reported revenues of $687.6 million, down 34.7% year on year, falling short of analysts’ expectations by 3.8%. It was a disappointing quarter as it posted a miss of analysts’ motorcycles sold estimates and a significant miss of analysts’ adjusted operating income estimates.
Harley-Davidson delivered the slowest revenue growth in the group. As expected, the stock is down 5.5% since the results and currently trades at $25.35.
Read our full analysis of Harley-Davidson’s results here.
Clarus (NASDAQ: CLAR)
Initially a financial services business, Clarus (NASDAQ: CLAR) designs, manufactures, and distributes outdoor equipment and lifestyle products.
Clarus reported revenues of $71.41 million, down 6.7% year on year. This print surpassed analysts’ expectations by 2.6%. Taking a step back, it was a slower quarter as it logged full-year revenue guidance missing analysts’ expectations and a significant miss of analysts’ EPS estimates.
Clarus had the weakest full-year guidance update among its peers. The stock is down 3.6% since reporting and currently trades at $4.12.
Read our full, actionable report on Clarus here, it’s free.
Smith & Wesson (NASDAQ: SWBI)
With a history dating back to 1852, Smith & Wesson (NASDAQ: SWBI) is a firearms manufacturer known for its handguns and rifles.
Smith & Wesson reported revenues of $115.9 million, down 15.7% year on year. This result came in 3% below analysts' expectations. Overall, it was a slower quarter for the company.
The stock is down 11.2% since reporting and currently trades at $9.80.
Read our full, actionable report on Smith & Wesson here, it’s free.
Want to invest in winners with rock-solid fundamentals? Check out our Top 6 Stocks and add them to your watchlist. These companies are poised for growth regardless of the political or macroeconomic climate.
Join Paid Stock Investor Research
Help us make StockStory more helpful to investors like yourself. Join our paid user research session and receive a $50 Amazon gift card for your opinions. Sign up here.