In a sliding market, 8x8 has defied the odds, trading up to $2.18 per share. Its 13% gain since September 2024 has outpaced the S&P 500’s 1.4% drop. This run-up might have investors contemplating their next move.
Is there a buying opportunity in 8x8, or does it present a risk to your portfolio? See what our analysts have to say in our full research report, it’s free.
We’re glad investors have benefited from the price increase, but we're cautious about 8x8. Here are three reasons why we avoid EGHT and a stock we'd rather own.
Why Do We Think 8x8 Will Underperform?
Founded in 1987, 8x8 (NYSE: EGHT) provides software for organizations to efficiently communicate and collaborate with their customers, employees, and partners.
1. Declining Billings Reflect Product and Sales Weakness
Billings is a non-GAAP metric that is often called “cash revenue” because it shows how much money the company has collected from customers in a certain period. This is different from revenue, which must be recognized in pieces over the length of a contract.
8x8’s billings came in at $176.3 million in Q4, and it averaged 2.1% year-on-year declines over the last four quarters. This performance was underwhelming and shows the company faced challenges in acquiring and retaining customers. It also suggests there may be increasing competition or market saturation. 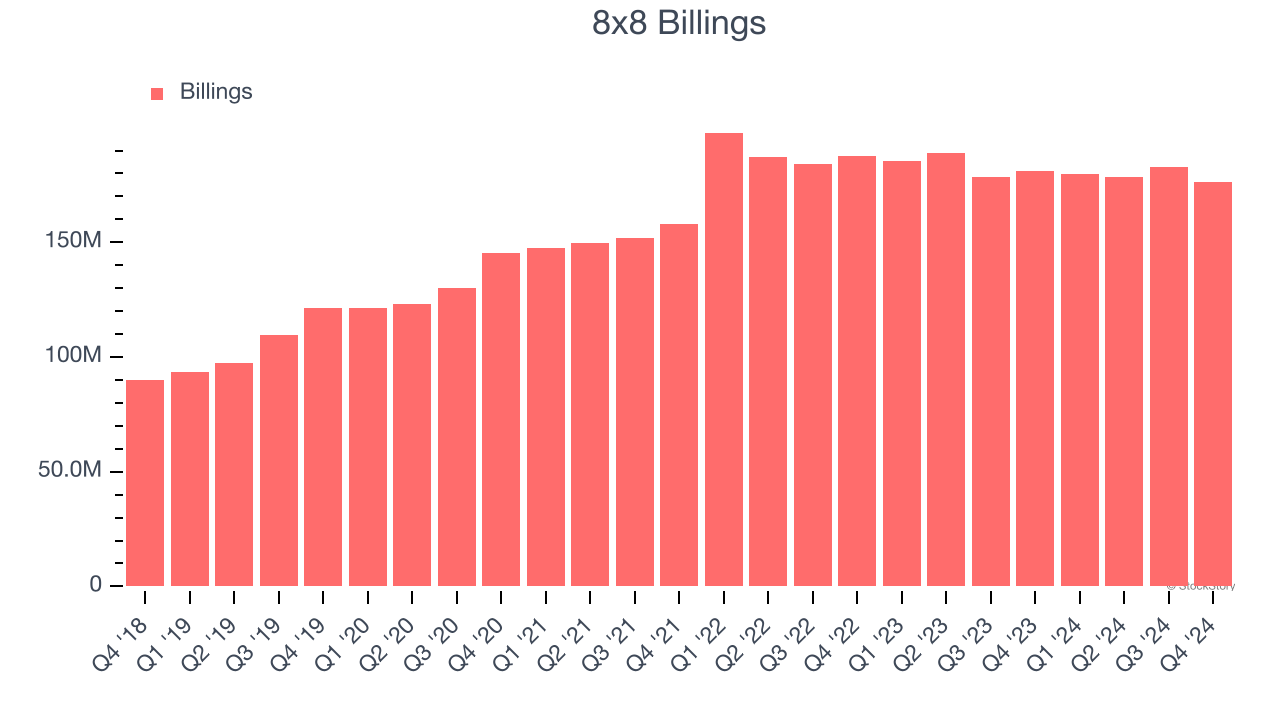
2. Projected Revenue Growth Shows Limited Upside
Forecasted revenues by Wall Street analysts signal a company’s potential. Predictions may not always be accurate, but accelerating growth typically boosts valuation multiples and stock prices while slowing growth does the opposite.
Over the next 12 months, sell-side analysts expect 8x8’s revenue to stall, a deceleration versus its 6.1% annualized growth for the past three years. This projection doesn't excite us and indicates its products and services will see some demand headwinds.
3. Long Payback Periods Delay Returns
The customer acquisition cost (CAC) payback period measures the months a company needs to recoup the money spent on acquiring a new customer. This metric helps assess how quickly a business can break even on its sales and marketing investments.
8x8’s recent customer acquisition efforts haven’t yielded returns as its CAC payback period was negative this quarter, meaning its incremental sales and marketing investments outpaced its revenue. The company’s inefficiency indicates it operates in a highly competitive environment where there is little differentiation between 8x8’s products and its peers.
Final Judgment
8x8 doesn’t pass our quality test. With its shares beating the market recently, the stock trades at 0.4× forward price-to-sales (or $2.18 per share). While this valuation is optically cheap, the potential downside is huge given its shaky fundamentals. There are more exciting stocks to buy at the moment. Let us point you toward the Amazon and PayPal of Latin America.
Stocks We Like More Than 8x8
The Trump trade may have passed, but rates are still dropping and inflation is still cooling. Opportunities are ripe for those ready to act - and we’re here to help you pick them.
Get started by checking out our Top 5 Growth Stocks for this month. This is a curated list of our High Quality stocks that have generated a market-beating return of 175% over the last five years.
Stocks that made our list in 2019 include now familiar names such as Nvidia (+2,183% between December 2019 and December 2024) as well as under-the-radar businesses like Sterling Infrastructure (+1,096% five-year return). Find your next big winner with StockStory today for free.


