Amdocs has been treading water for the past six months, recording a small return of 3.2% while holding steady at $89.48.
Is now the time to buy Amdocs, or should you be careful about including it in your portfolio? Check out our in-depth research report to see what our analysts have to say, it’s free.
We're swiping left on Amdocs for now. Here are three reasons why you should be careful with DOX and a stock we'd rather own.
Why Do We Think Amdocs Will Underperform?
Powering the digital experiences of approximately 400 communications companies worldwide, Amdocs (NASDAQ: DOX) provides software and services that help telecommunications and media companies manage customer relationships, monetize services, and automate network operations.
1. Weak Backlog Growth Points to Soft Demand
Investors interested in Enterprise Networking companies should track backlog in addition to reported revenue. This metric shows the value of outstanding orders that have not yet been executed or delivered, giving visibility into Amdocs’s future revenue streams.
Amdocs’s backlog came in at $4.14 billion in the latest quarter, and over the last two years, its year-on-year growth averaged 2.5%. This performance was underwhelming and suggests that increasing competition is causing challenges in winning new orders. 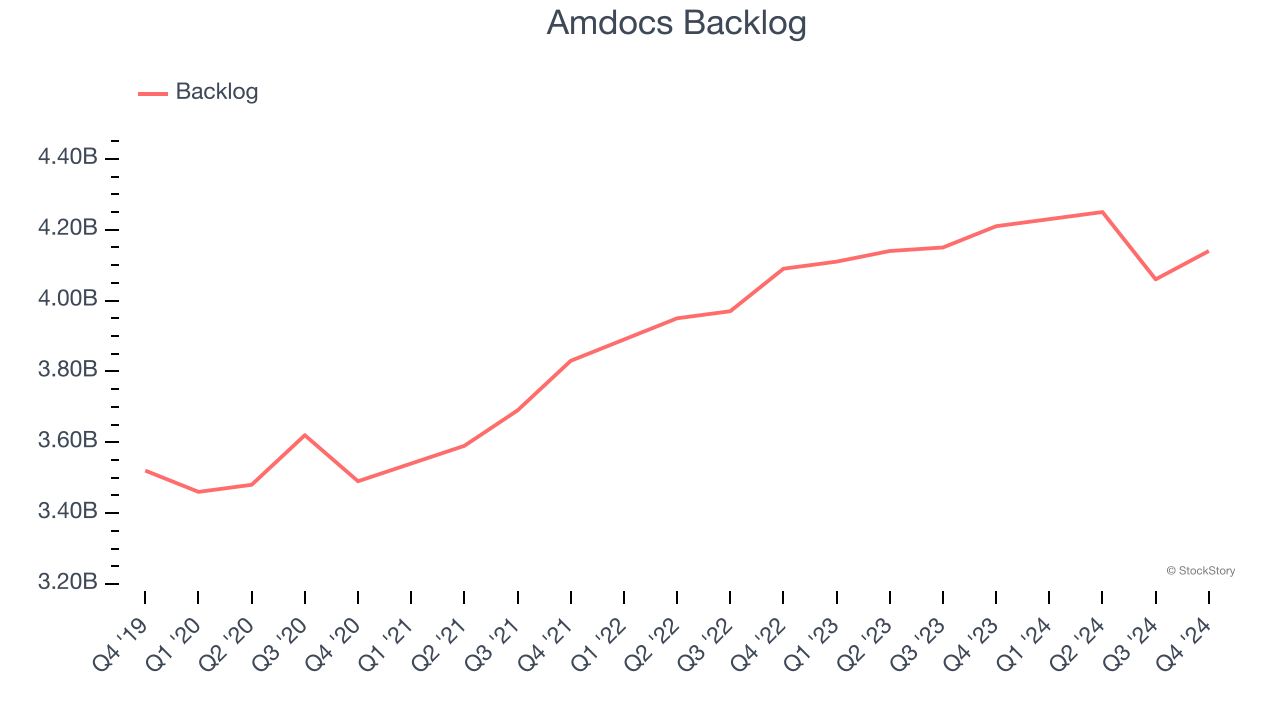
2. Revenue Projections Show Stormy Skies Ahead
Forecasted revenues by Wall Street analysts signal a company’s potential. Predictions may not always be accurate, but accelerating growth typically boosts valuation multiples and stock prices while slowing growth does the opposite.
Over the next 12 months, sell-side analysts expect Amdocs’s revenue to drop by 6.6%, a decrease from its 2.3% annualized growth for the past two years. This projection doesn't excite us and implies its products and services will see some demand headwinds.
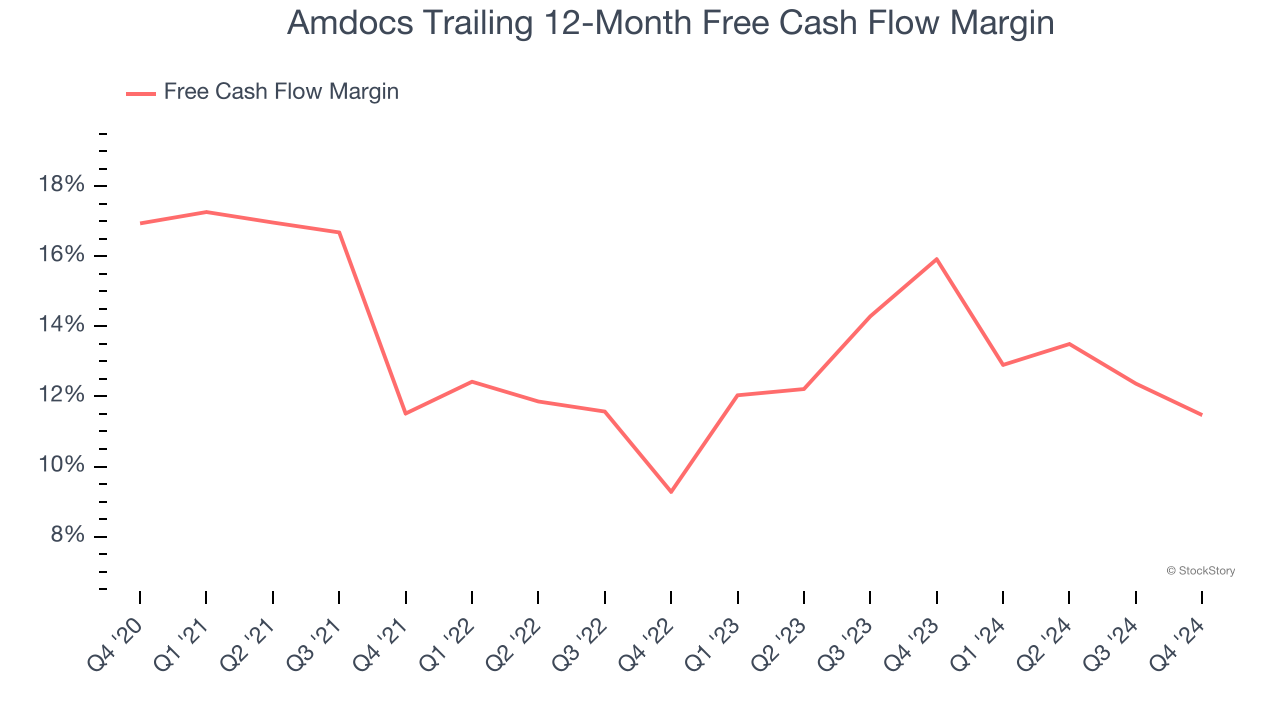
3. Free Cash Flow Margin Dropping
If you’ve followed StockStory for a while, you know we emphasize free cash flow. Why, you ask? We believe that in the end, cash is king, and you can’t use accounting profits to pay the bills.
As you can see below, Amdocs’s margin dropped by 5.5 percentage points over the last five years. If its declines continue, it could signal increasing investment needs and capital intensity. Amdocs’s free cash flow margin for the trailing 12 months was 11.5%.
Final Judgment
We cheer for all companies serving everyday consumers, but in the case of Amdocs, we’ll be cheering from the sidelines. That said, the stock currently trades at 12.2× forward price-to-earnings (or $89.48 per share). At this valuation, there’s a lot of good news priced in - we think there are better opportunities elsewhere. We’d suggest looking at one of Charlie Munger’s all-time favorite businesses.
Stocks We Like More Than Amdocs
With rates dropping, inflation stabilizing, and the elections in the rearview mirror, all signs point to the start of a new bull run - and we’re laser-focused on finding the best stocks for this upcoming cycle.
Put yourself in the driver’s seat by checking out our Top 5 Growth Stocks for this month. This is a curated list of our High Quality stocks that have generated a market-beating return of 175% over the last five years.
Stocks that made our list in 2019 include now familiar names such as Nvidia (+2,183% between December 2019 and December 2024) as well as under-the-radar businesses like Comfort Systems (+751% five-year return). Find your next big winner with StockStory today for free.