Since September 2024, Kadant has been in a holding pattern, posting a small return of 3.8% while floating around $345.55.
Is now the time to buy Kadant, or should you be careful about including it in your portfolio? Get the full stock story straight from our expert analysts, it’s free.
We're sitting this one out for now. Here are three reasons why KAI doesn't excite us and a stock we'd rather own.
Why Is Kadant Not Exciting?
Headquartered in Massachusetts, Kadant (NYSE: KAI) is a global supplier of high-value, critical components and engineered systems used in process industries worldwide.
1. Projected Revenue Growth Shows Limited Upside
Forecasted revenues by Wall Street analysts signal a company’s potential. Predictions may not always be accurate, but accelerating growth typically boosts valuation multiples and stock prices while slowing growth does the opposite.
Over the next 12 months, sell-side analysts expect Kadant’s revenue to stall, a deceleration versus its 7.9% annualized growth for the past two years. This projection doesn't excite us and suggests its products and services will face some demand challenges.
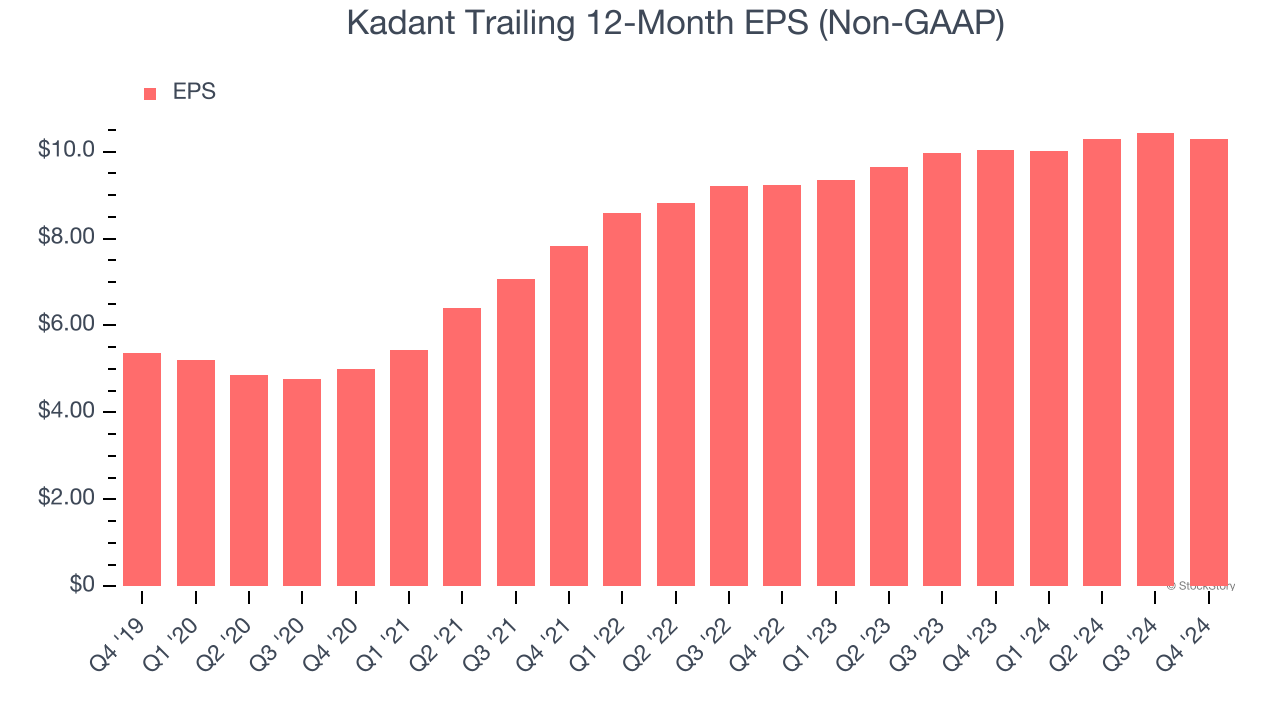
2. Recent EPS Growth Below Our Standards
While long-term earnings trends give us the big picture, we also track EPS over a shorter period because it can provide insight into an emerging theme or development for the business.
Kadant’s EPS grew at an unimpressive 5.5% compounded annual growth rate over the last two years, lower than its 7.9% annualized revenue growth. This tells us the company became less profitable on a per-share basis as it expanded.
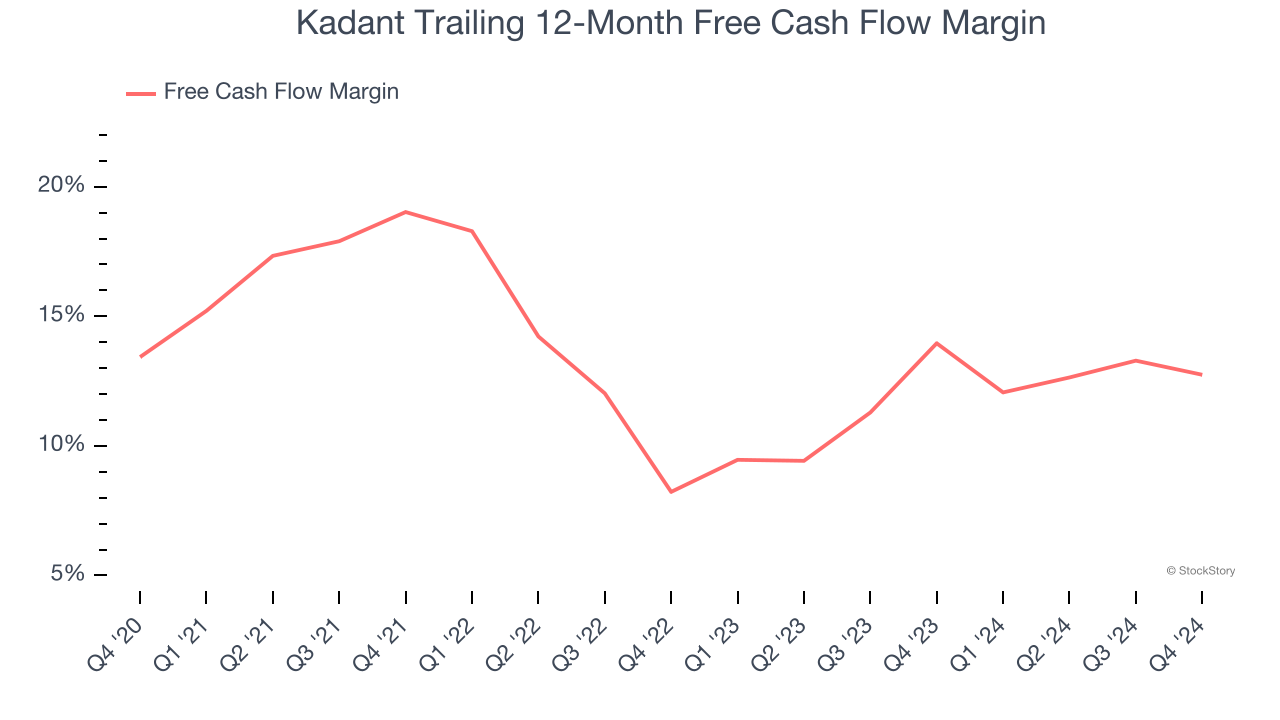
3. Free Cash Flow Margin Stuck in Neutral
Free cash flow isn't a prominently featured metric in company financials and earnings releases, but we think it's telling because it accounts for all operating and capital expenses, making it tough to manipulate. Cash is king.
As you can see below, Kadant’s margin was unchanged over the last five years, showing it couldn’t improve. Its free cash flow margin for the trailing 12 months was 12.7%.
Final Judgment
Kadant isn’t a terrible business, but it doesn’t pass our bar. That said, the stock currently trades at 31.4× forward price-to-earnings (or $345.55 per share). At this valuation, there’s a lot of good news priced in - we think there are better investment opportunities out there. Let us point you toward a fast-growing restaurant franchise with an A+ ranch dressing sauce.
Stocks We Would Buy Instead of Kadant
With rates dropping, inflation stabilizing, and the elections in the rearview mirror, all signs point to the start of a new bull run - and we’re laser-focused on finding the best stocks for this upcoming cycle.
Put yourself in the driver’s seat by checking out our Top 6 Stocks for this week. This is a curated list of our High Quality stocks that have generated a market-beating return of 175% over the last five years.
Stocks that made our list in 2019 include now familiar names such as Nvidia (+2,183% between December 2019 and December 2024) as well as under-the-radar businesses like Sterling Infrastructure (+1,096% five-year return). Find your next big winner with StockStory today for free.