
Silgan Holdings currently trades at $50.26 per share and has shown little upside over the past six months, posting a small loss of 1.1%.
Is there a buying opportunity in Silgan Holdings, or does it present a risk to your portfolio? Check out our in-depth research report to see what our analysts have to say, it’s free.
We're cautious about Silgan Holdings. Here are three reasons why SLGN doesn't excite us and a stock we'd rather own.
Why Do We Think Silgan Holdings Will Underperform?
Established in 1987, Silgan Holdings (NYSE: SLGN) is a supplier of rigid packaging for consumer goods products, specializing in metal containers, closures, and plastic packaging.
1. Long-Term Revenue Growth Disappoints
A company’s long-term sales performance is one signal of its overall quality. Any business can have short-term success, but a top-tier one grows for years. Unfortunately, Silgan Holdings’s 5.5% annualized revenue growth over the last five years was tepid. This fell short of our benchmark for the industrials sector. 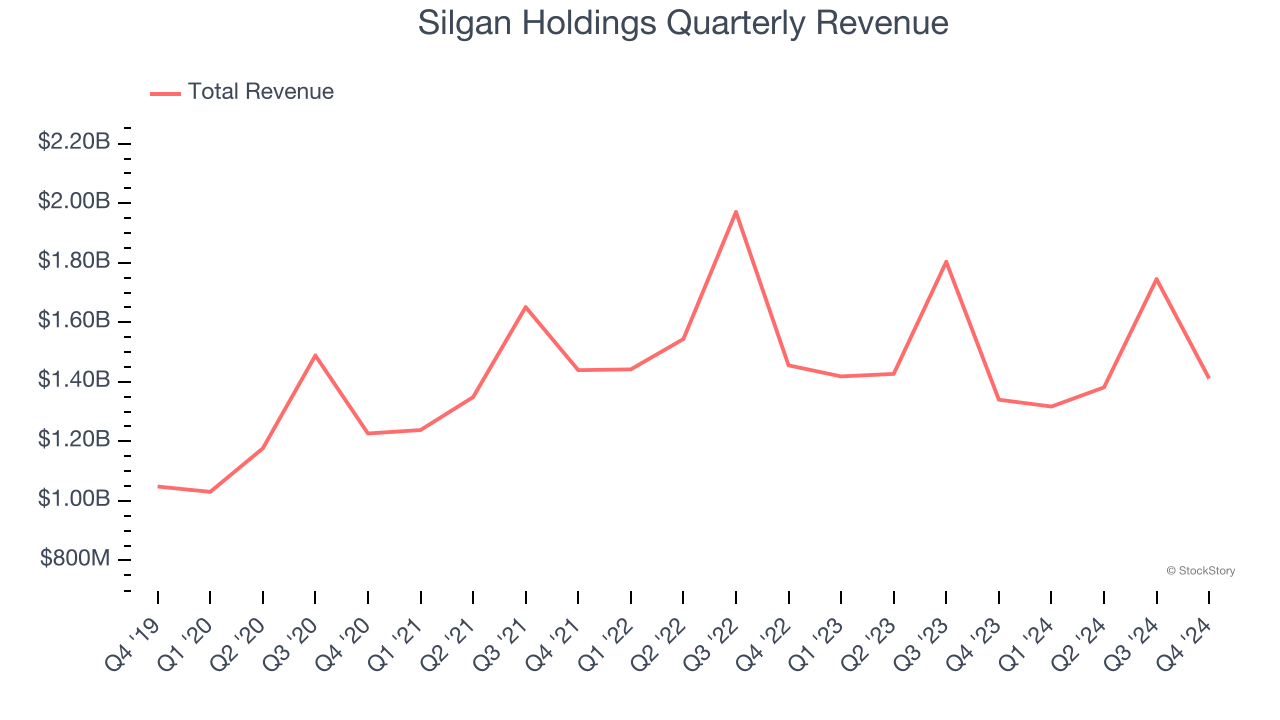
2. Core Business Falling Behind as Demand Declines
In addition to reported revenue, organic revenue is a useful data point for analyzing Industrial Packaging companies. This metric gives visibility into Silgan Holdings’s core business because it excludes one-time events such as mergers, acquisitions, and divestitures along with foreign currency fluctuations - non-fundamental factors that can manipulate the income statement.
Over the last two years, Silgan Holdings’s organic revenue averaged 4.7% year-on-year declines. This performance was underwhelming and implies it may need to improve its products, pricing, or go-to-market strategy. It also suggests Silgan Holdings might have to lean into acquisitions to grow, which isn’t ideal because M&A can be expensive and risky (integrations often disrupt focus). 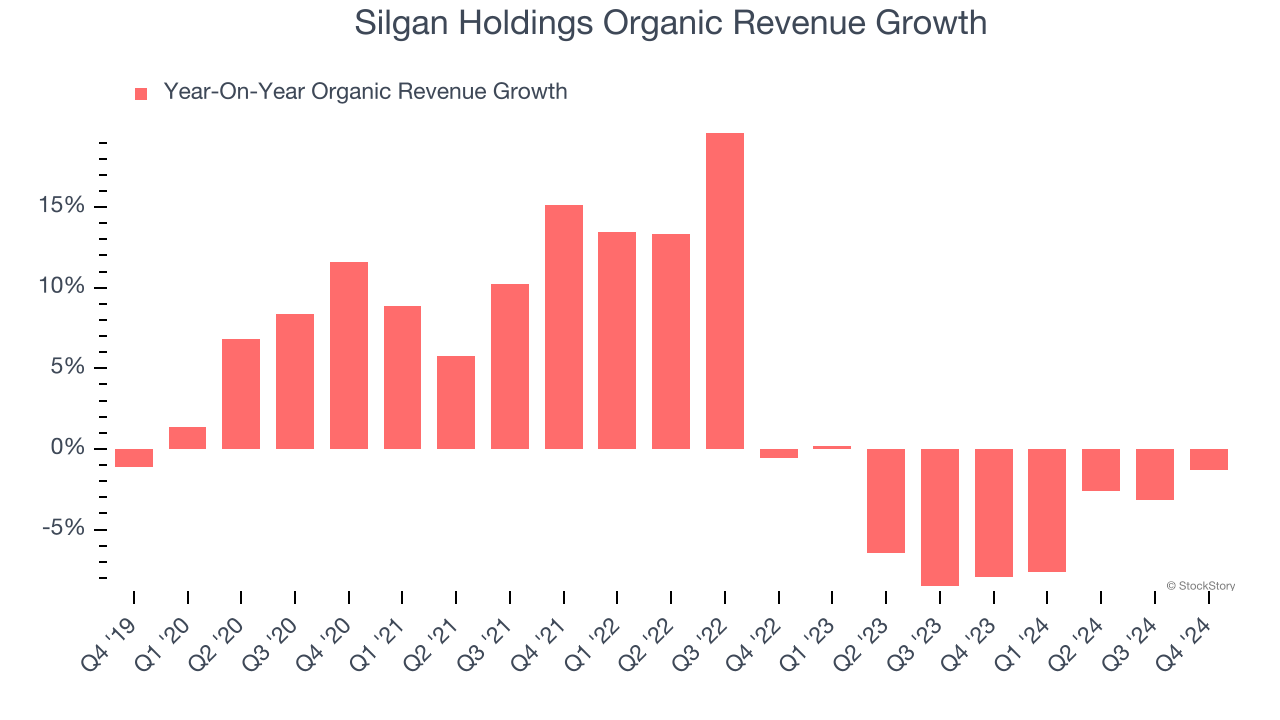
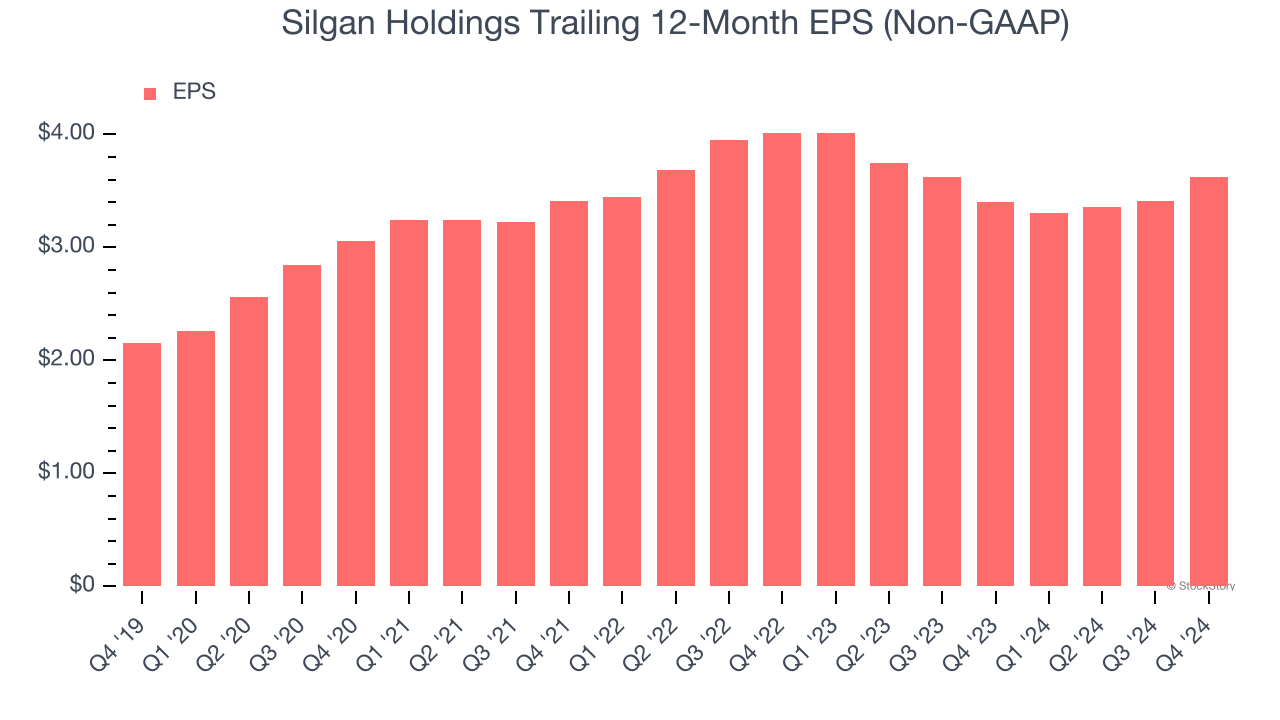
3. EPS Took a Dip Over the Last Two Years
While long-term earnings trends give us the big picture, we also track EPS over a shorter period because it can provide insight into an emerging theme or development for the business.
Sadly for Silgan Holdings, its EPS and revenue declined by 5% and 4.4% annually over the last two years. We tend to steer our readers away from companies with falling revenue and EPS, where diminishing earnings could imply changing secular trends and preferences. If the tide turns unexpectedly, Silgan Holdings’s low margin of safety could leave its stock price susceptible to large downswings.
Final Judgment
We cheer for all companies making their customers lives easier, but in the case of Silgan Holdings, we’ll be cheering from the sidelines. That said, the stock currently trades at 12.2× forward price-to-earnings (or $50.26 per share). This valuation is reasonable, but the company’s shaky fundamentals present too much downside risk. There are better investments elsewhere. We’d recommend looking at the most entrenched endpoint security platform on the market.
Stocks We Like More Than Silgan Holdings
With rates dropping, inflation stabilizing, and the elections in the rearview mirror, all signs point to the start of a new bull run - and we’re laser-focused on finding the best stocks for this upcoming cycle.
Put yourself in the driver’s seat by checking out our Top 9 Market-Beating Stocks. This is a curated list of our High Quality stocks that have generated a market-beating return of 175% over the last five years.
Stocks that made our list in 2019 include now familiar names such as Nvidia (+2,183% between December 2019 and December 2024) as well as under-the-radar businesses like Comfort Systems (+751% five-year return). Find your next big winner with StockStory today for free.


