
Over the past six months, Royalty Pharma has been a great trade. While the S&P 500 was flat, the stock price has climbed by 17.3% to $33.06 per share. This performance may have investors wondering how to approach the situation.
Is there a buying opportunity in Royalty Pharma, or does it present a risk to your portfolio? See what our analysts have to say in our full research report, it’s free.
Despite the momentum, we're swiping left on Royalty Pharma for now. Here are three reasons why there are better opportunities than RPRX and a stock we'd rather own.
Why Is Royalty Pharma Not Exciting?
Pioneering a unique business model in the pharmaceutical industry since 1996, Royalty Pharma (NASDAQ: RPRX) acquires rights to receive portions of sales from successful biopharmaceutical products, providing funding to drug developers without conducting research itself.
1. Long-Term Revenue Growth Disappoints
A company’s long-term sales performance is one signal of its overall quality. Any business can put up a good quarter or two, but many enduring ones grow for years. Over the last five years, Royalty Pharma grew its sales at a mediocre 4.5% compounded annual growth rate. This was below our standard for the healthcare sector. 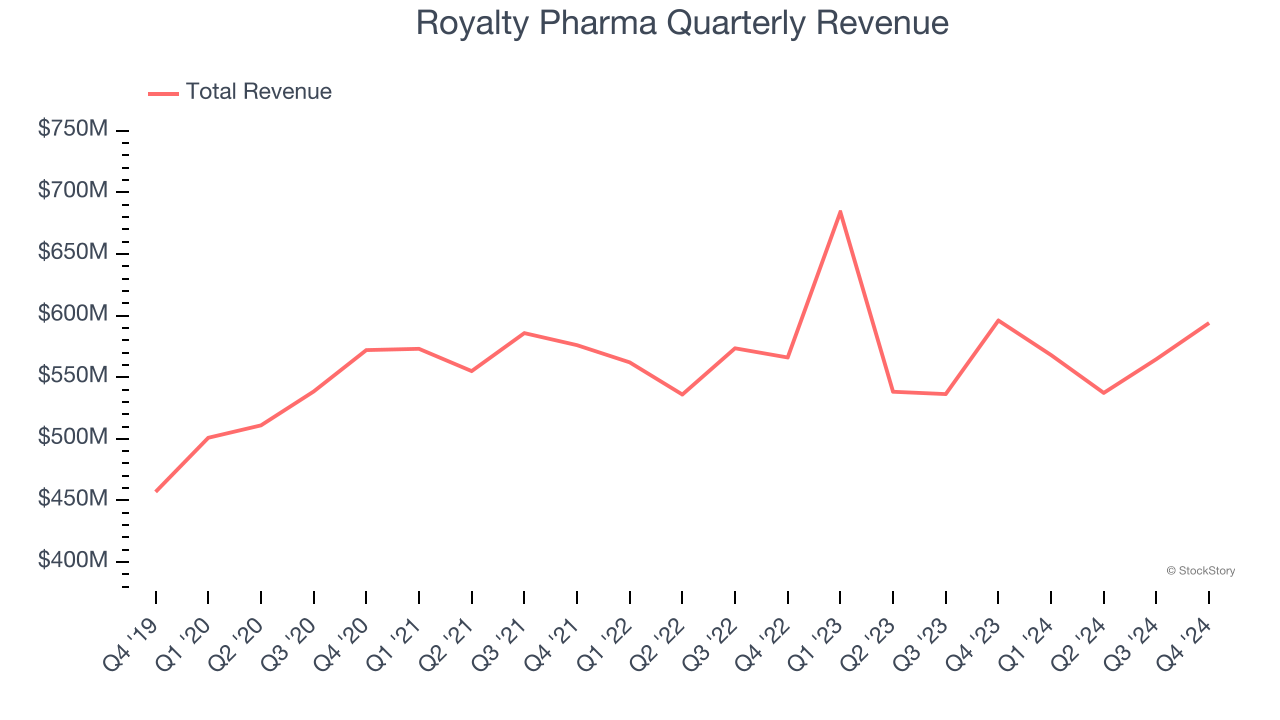
2. Fewer Distribution Channels than Larger Competitors
With $2.26 billion in revenue over the past 12 months, Royalty Pharma is a mid-sized healthcare company, which sometimes brings disadvantages compared to larger competitors benefiting from better economies of scale.
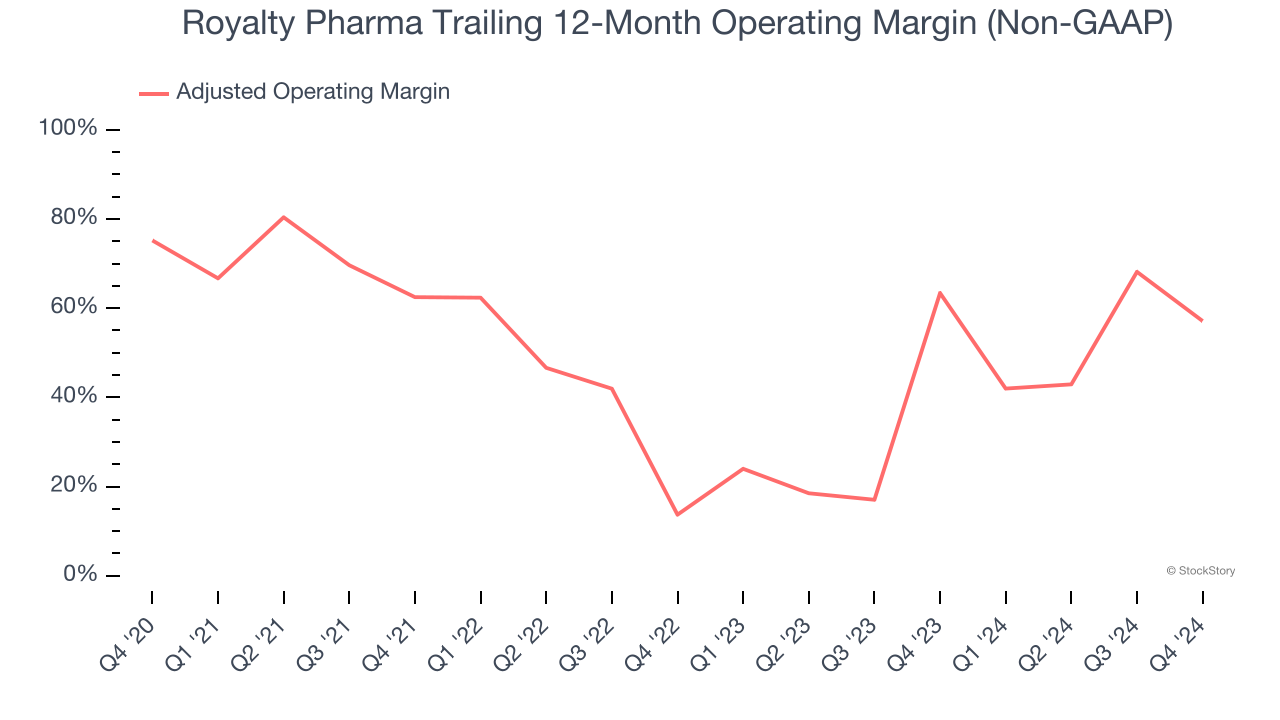
3. Shrinking Adjusted Operating Margin
Adjusted operating margin is an important measure of profitability as it shows the portion of revenue left after accounting for all core expenses – everything from the cost of goods sold to advertising and wages. It’s also useful for comparing profitability across companies because it excludes non-recurring expenses, interest on debt, and taxes.
Analyzing the trend in its profitability, Royalty Pharma’s adjusted operating margin decreased by 18.1 percentage points over the last five years. This raises questions about the company’s expense base because its revenue growth should have given it leverage on its fixed costs, resulting in better economies of scale and profitability. Its adjusted operating margin for the trailing 12 months was 57.1%.
Final Judgment
Royalty Pharma isn’t a terrible business, but it isn’t one of our picks. With its shares topping the market in recent months, the stock trades at 7× forward price-to-earnings (or $33.06 per share). While this valuation is reasonable, we don’t really see a big opportunity at the moment. We're pretty confident there are superior stocks to buy right now. We’d suggest looking at a top digital advertising platform riding the creator economy.
Stocks We Would Buy Instead of Royalty Pharma
The elections are now behind us. With rates dropping and inflation cooling, many analysts expect a breakout market - and we’re zeroing in on the stocks that could benefit immensely.
Take advantage of the rebound by checking out our Top 6 Stocks for this week. This is a curated list of our High Quality stocks that have generated a market-beating return of 175% over the last five years.
Stocks that made our list in 2019 include now familiar names such as Nvidia (+2,183% between December 2019 and December 2024) as well as under-the-radar businesses like Sterling Infrastructure (+1,096% five-year return). Find your next big winner with StockStory today for free.