Since September 2024, Church & Dwight has been in a holding pattern, posting a small return of 3.3% while floating around $106.31.
Is there a buying opportunity in Church & Dwight, or does it present a risk to your portfolio? Check out our in-depth research report to see what our analysts have to say, it’s free.
We're sitting this one out for now. Here are three reasons why we avoid CHD and a stock we'd rather own.
Why Is Church & Dwight Not Exciting?
Best known for its Arm & Hammer baking soda, Church & Dwight (NYSE: CHD) is a household and personal care products company with a vast portfolio that spans laundry detergent to toothbrushes to hair removal creams.
1. Slow Organic Growth Suggests Waning Demand In Core Business
When analyzing revenue growth, we care most about organic revenue growth. This metric captures a business’s performance excluding one-time events such as mergers, acquisitions, and divestitures as well as foreign currency fluctuations.
The demand for Church & Dwight’s products has generally risen over the last two years but lagged behind the broader sector. On average, the company’s organic sales have grown by 4.9% year on year. 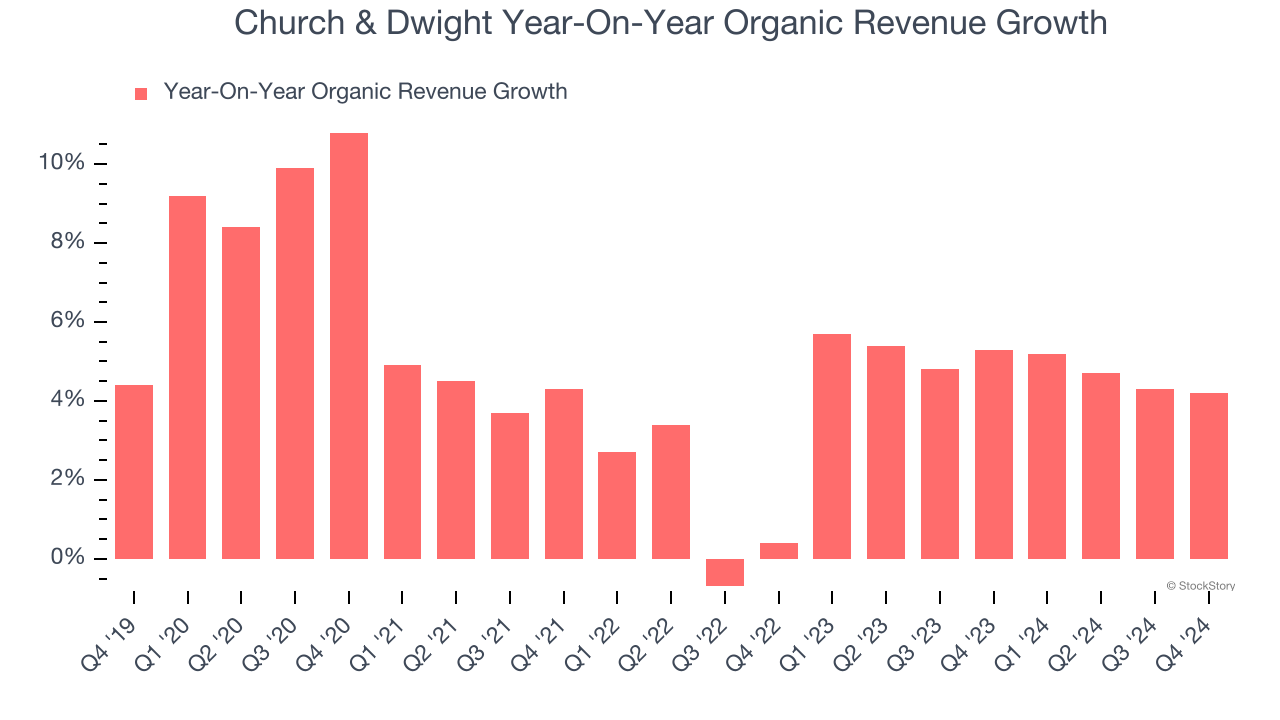
2. Projected Revenue Growth Is Slim
Forecasted revenues by Wall Street analysts signal a company’s potential. Predictions may not always be accurate, but accelerating growth typically boosts valuation multiples and stock prices while slowing growth does the opposite.
Over the next 12 months, sell-side analysts expect Church & Dwight’s revenue to rise by 3%, a slight deceleration versus its 5.6% annualized growth for the past three years. This projection doesn't excite us and suggests its products will face some demand challenges.
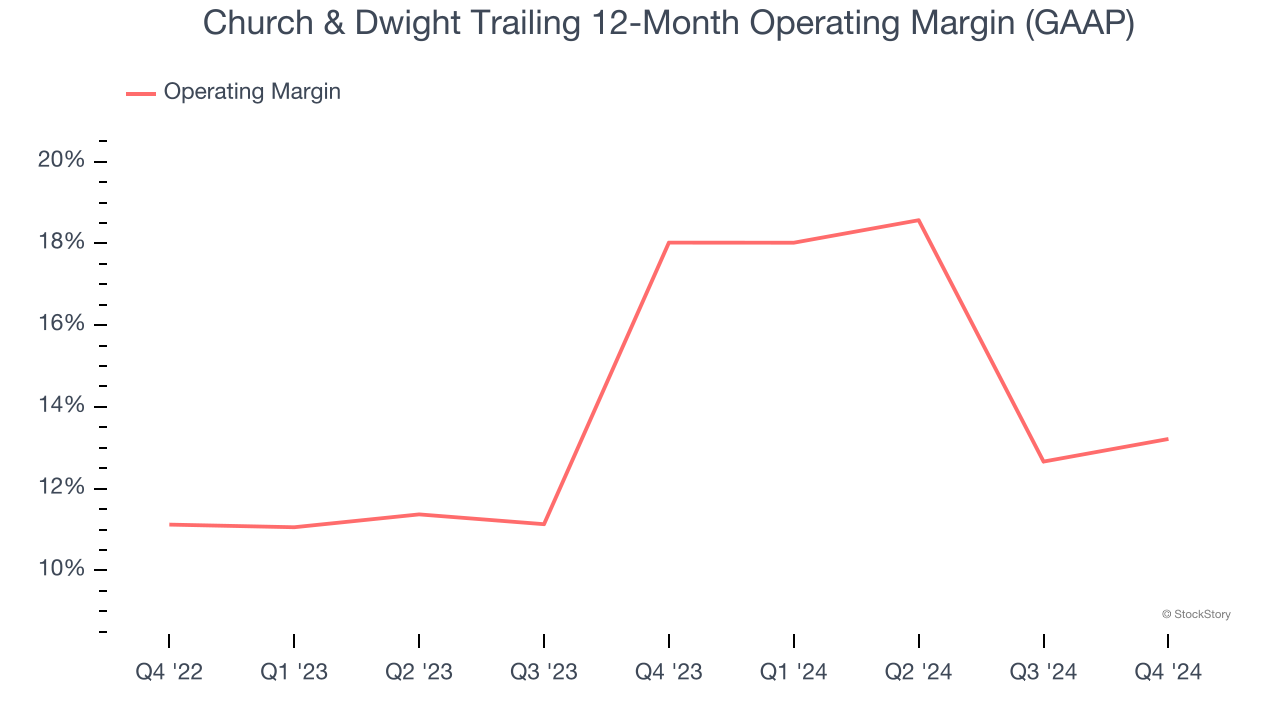
3. Shrinking Operating Margin
Operating margin is a key measure of profitability. Think of it as net income - the bottom line - excluding the impact of taxes and interest on debt, which are less connected to business fundamentals.
Looking at the trend in its profitability, Church & Dwight’s operating margin decreased by 4.8 percentage points over the last year. This raises questions about the company’s expense base because its revenue growth should have given it leverage on its fixed costs, resulting in better economies of scale and profitability. Its operating margin for the trailing 12 months was 13.2%.
Final Judgment
Church & Dwight isn’t a terrible business, but it isn’t one of our picks. That said, the stock currently trades at 28.5× forward price-to-earnings (or $106.31 per share). This multiple tells us a lot of good news is priced in - we think there are better investment opportunities out there. We’d suggest looking at the Amazon and PayPal of Latin America.
Stocks We Would Buy Instead of Church & Dwight
The elections are now behind us. With rates dropping and inflation cooling, many analysts expect a breakout market - and we’re zeroing in on the stocks that could benefit immensely.
Take advantage of the rebound by checking out our Top 6 Stocks for this week. This is a curated list of our High Quality stocks that have generated a market-beating return of 175% over the last five years.
Stocks that made our list in 2019 include now familiar names such as Nvidia (+2,183% between December 2019 and December 2024) as well as under-the-radar businesses like Comfort Systems (+751% five-year return). Find your next big winner with StockStory today for free.