
Northwest Pipe trades at $43.17 per share and has tracked the market over the last six months. The stock is down 5.1% while the S&P 500 is flat. This may have investors wondering how to approach the situation.
Is there a buying opportunity in Northwest Pipe, or does it present a risk to your portfolio? Dive into our full research report to see our analyst team’s opinion, it’s free.
Despite the more favorable entry price, we're sitting this one out for now. Here are three reasons why you should be careful with NWPX and a stock we'd rather own.
Why Do We Think Northwest Pipe Will Underperform?
Playing a large role in the Integrated Pipeline (IPL) project in Texas to deliver ~350 million gallons of water per day, Northwest Pipe (NASDAQ: NWPX) is a manufacturer of pipeline systems for water infrastructure.
1. Lackluster Revenue Growth
Long-term growth is the most important, but within industrials, a stretched historical view may miss new industry trends or demand cycles. Northwest Pipe’s recent performance shows its demand has slowed significantly as its annualized revenue growth of 3.7% over the last two years was well below its five-year trend. 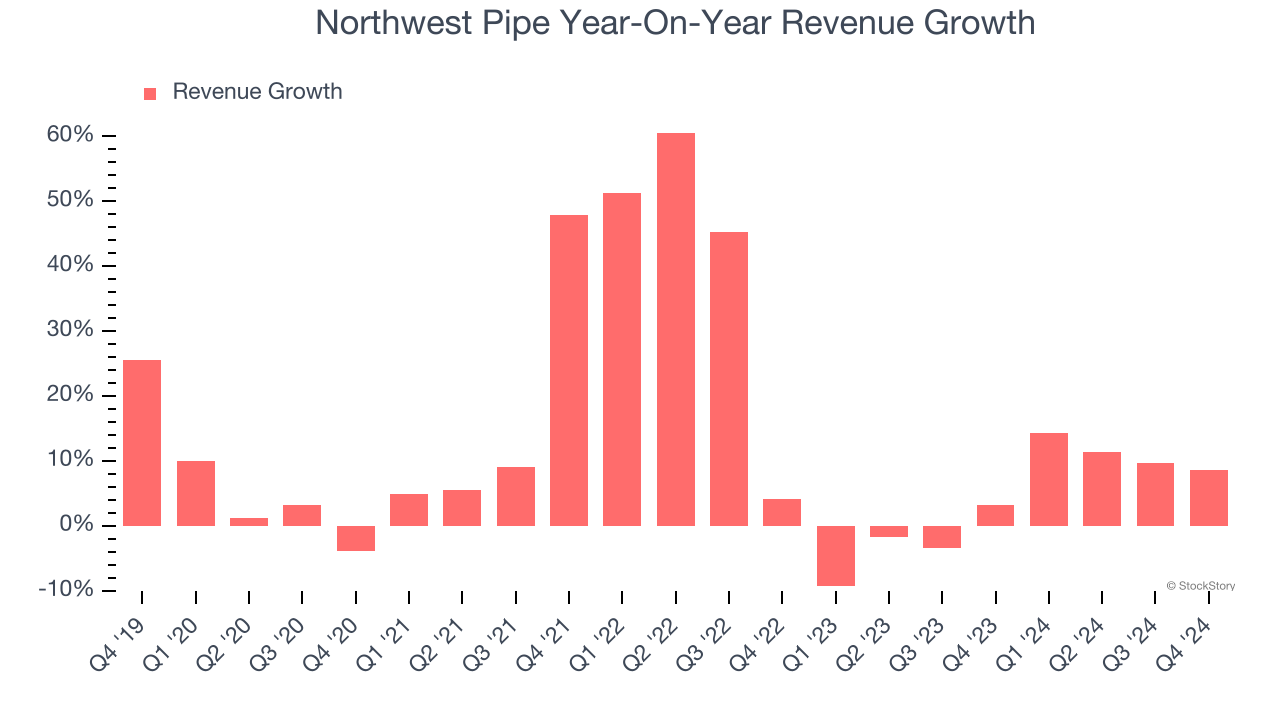
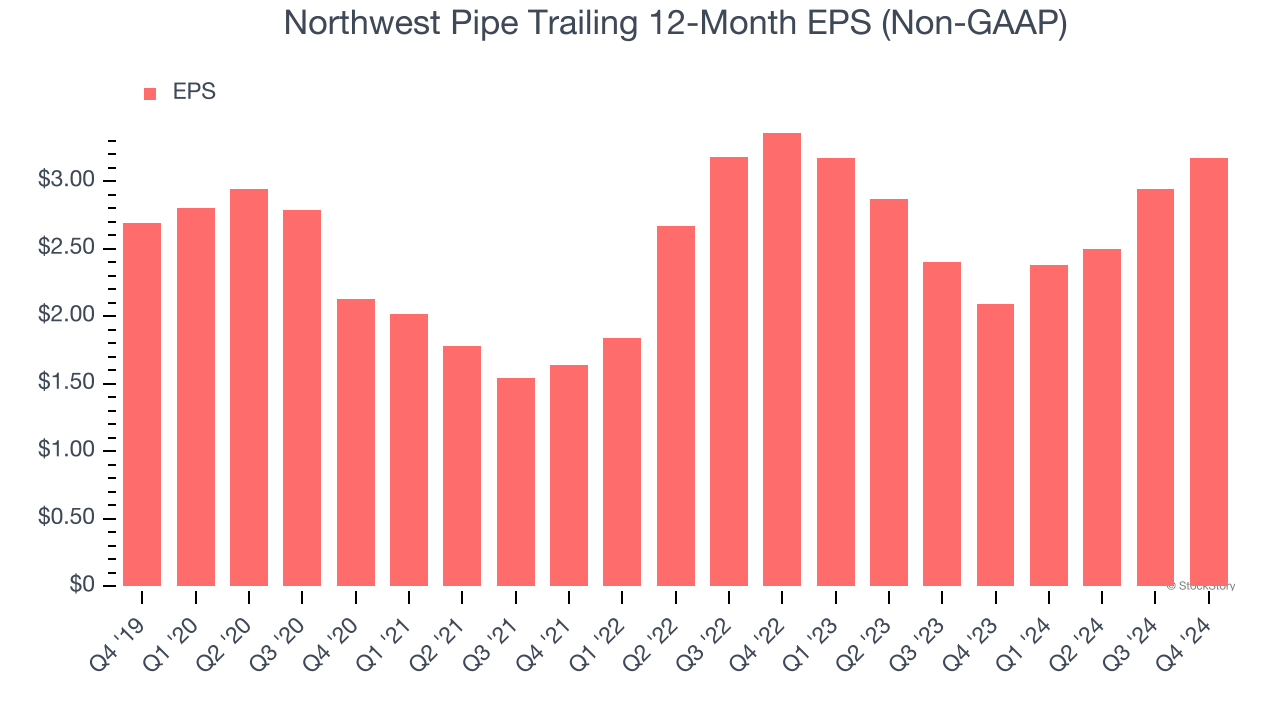
2. EPS Barely Growing
Analyzing the long-term change in earnings per share (EPS) shows whether a company's incremental sales were profitable – for example, revenue could be inflated through excessive spending on advertising and promotions.
Northwest Pipe’s EPS grew at a weak 3.3% compounded annual growth rate over the last five years, lower than its 12% annualized revenue growth. This tells us the company became less profitable on a per-share basis as it expanded.
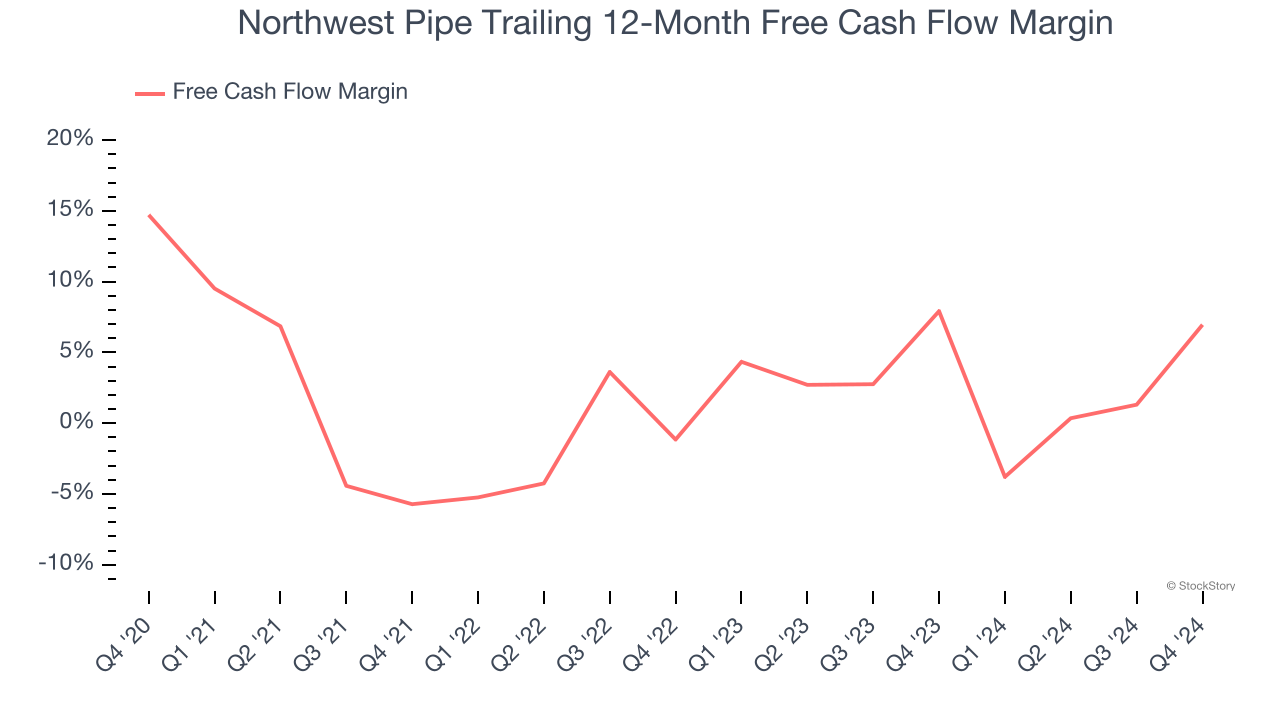
3. Free Cash Flow Margin Dropping
Free cash flow isn't a prominently featured metric in company financials and earnings releases, but we think it's telling because it accounts for all operating and capital expenses, making it tough to manipulate. Cash is king.
As you can see below, Northwest Pipe’s margin dropped by 7.8 percentage points over the last five years. This along with its unexciting margin put the company in a tough spot, and shareholders are likely hoping it can reverse course. If the trend continues, it could signal it’s becoming a more capital-intensive business. Northwest Pipe’s free cash flow margin for the trailing 12 months was 7%.
Final Judgment
We cheer for all companies making their customers lives easier, but in the case of Northwest Pipe, we’ll be cheering from the sidelines. Following the recent decline, the stock trades at 12.4× forward price-to-earnings (or $43.17 per share). While this valuation is reasonable, we don’t see a big opportunity at the moment. There are superior stocks to buy right now. We’d recommend looking at the Amazon and PayPal of Latin America.
Stocks We Like More Than Northwest Pipe
With rates dropping, inflation stabilizing, and the elections in the rearview mirror, all signs point to the start of a new bull run - and we’re laser-focused on finding the best stocks for this upcoming cycle.
Put yourself in the driver’s seat by checking out our Top 9 Market-Beating Stocks. This is a curated list of our High Quality stocks that have generated a market-beating return of 175% over the last five years.
Stocks that made our list in 2019 include now familiar names such as Nvidia (+2,183% between December 2019 and December 2024) as well as under-the-radar businesses like Comfort Systems (+751% five-year return). Find your next big winner with StockStory today for free.


