
In a sliding market, Middleby has defied the odds, trading up to $157.28 per share. Its 13% gain since September 2024 has outpaced the S&P 500’s 1.4% drop. This was partly thanks to its solid quarterly results, and the performance may have investors wondering how to approach the situation.
Is there a buying opportunity in Middleby, or does it present a risk to your portfolio? See what our analysts have to say in our full research report, it’s free.
We’re glad investors have benefited from the price increase, but we're sitting this one out for now. Here are three reasons why you should be careful with MIDD and a stock we'd rather own.
Why Do We Think Middleby Will Underperform?
Holding a Guinness World Record for creating the world’s fastest conveyor pizza oven, Middleby (NYSE: MIDD) is a food service and equipment manufacturer.
1. Core Business Falling Behind as Demand Declines
Investors interested in Professional Tools and Equipment companies should track organic revenue in addition to reported revenue. This metric gives visibility into Middleby’s core business because it excludes one-time events such as mergers, acquisitions, and divestitures along with foreign currency fluctuations - non-fundamental factors that can manipulate the income statement.
Over the last two years, Middleby’s organic revenue averaged 4% year-on-year declines. This performance was underwhelming and implies it may need to improve its products, pricing, or go-to-market strategy. It also suggests Middleby might have to lean into acquisitions to grow, which isn’t ideal because M&A can be expensive and risky (integrations often disrupt focus). 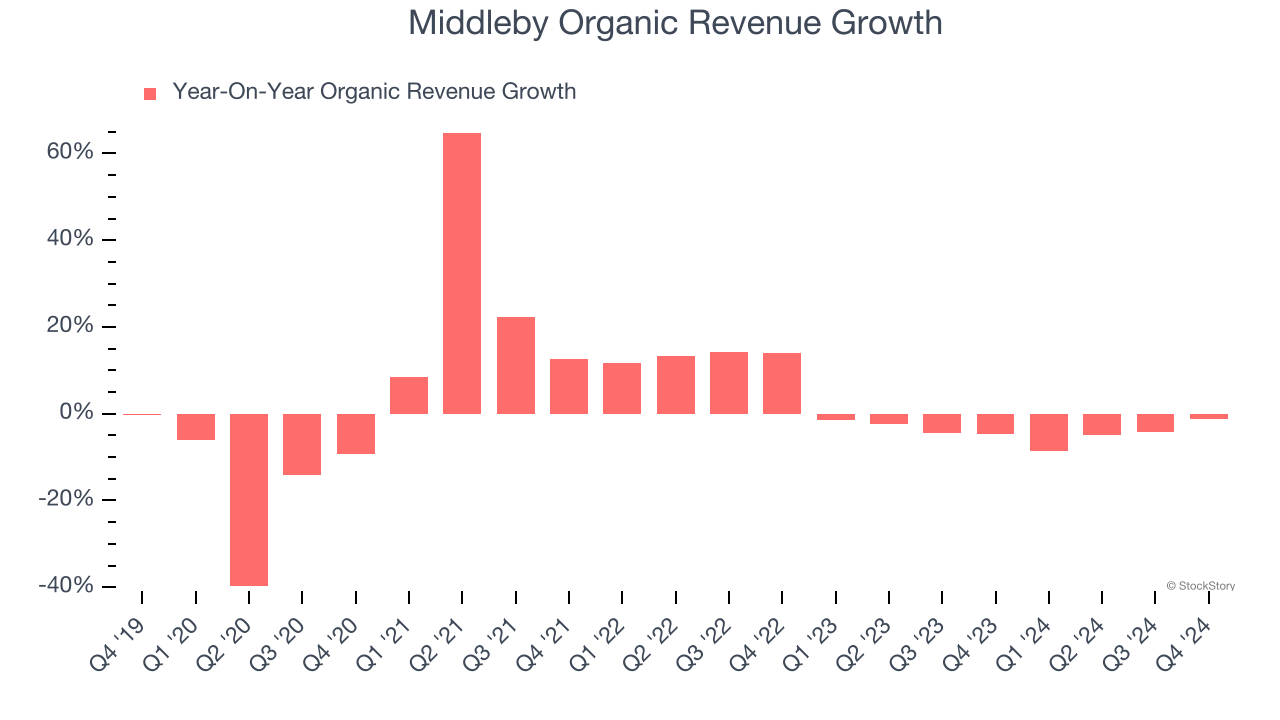
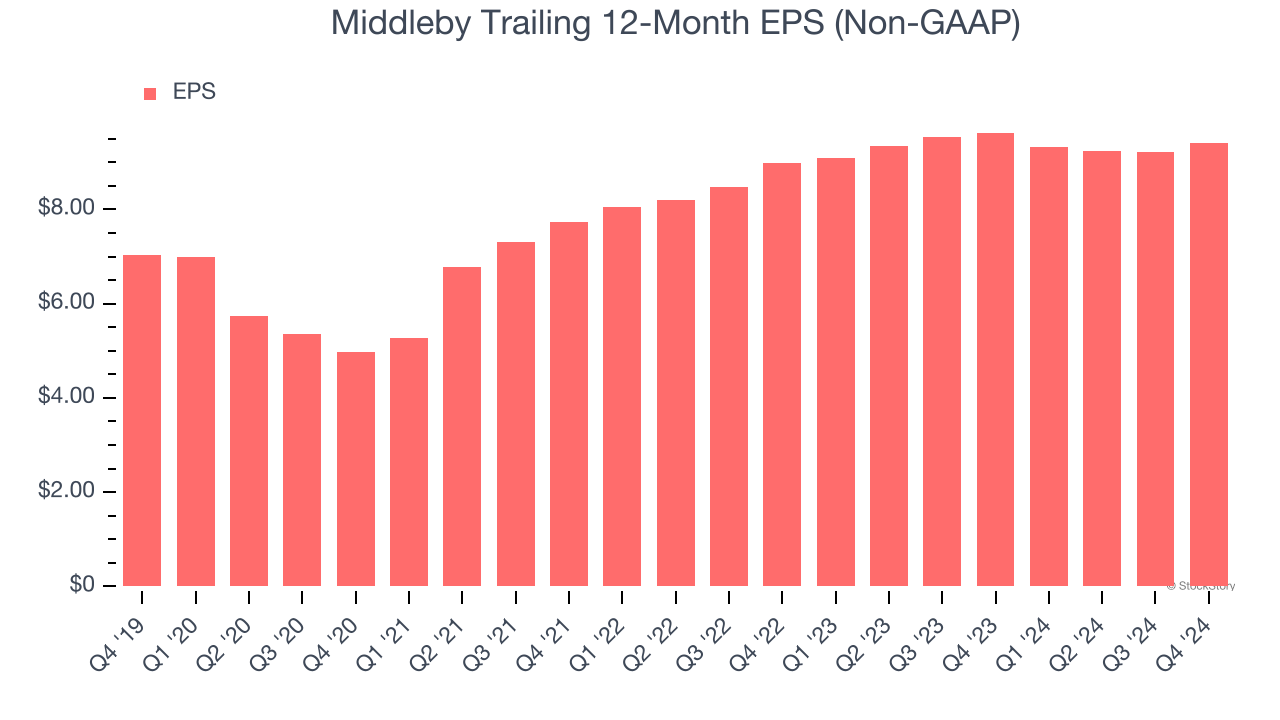
2. EPS Barely Growing
Analyzing the long-term change in earnings per share (EPS) shows whether a company's incremental sales were profitable – for example, revenue could be inflated through excessive spending on advertising and promotions.
Middleby’s unimpressive 6% annual EPS growth over the last five years aligns with its revenue performance. On the bright side, this tells us its incremental sales were profitable.
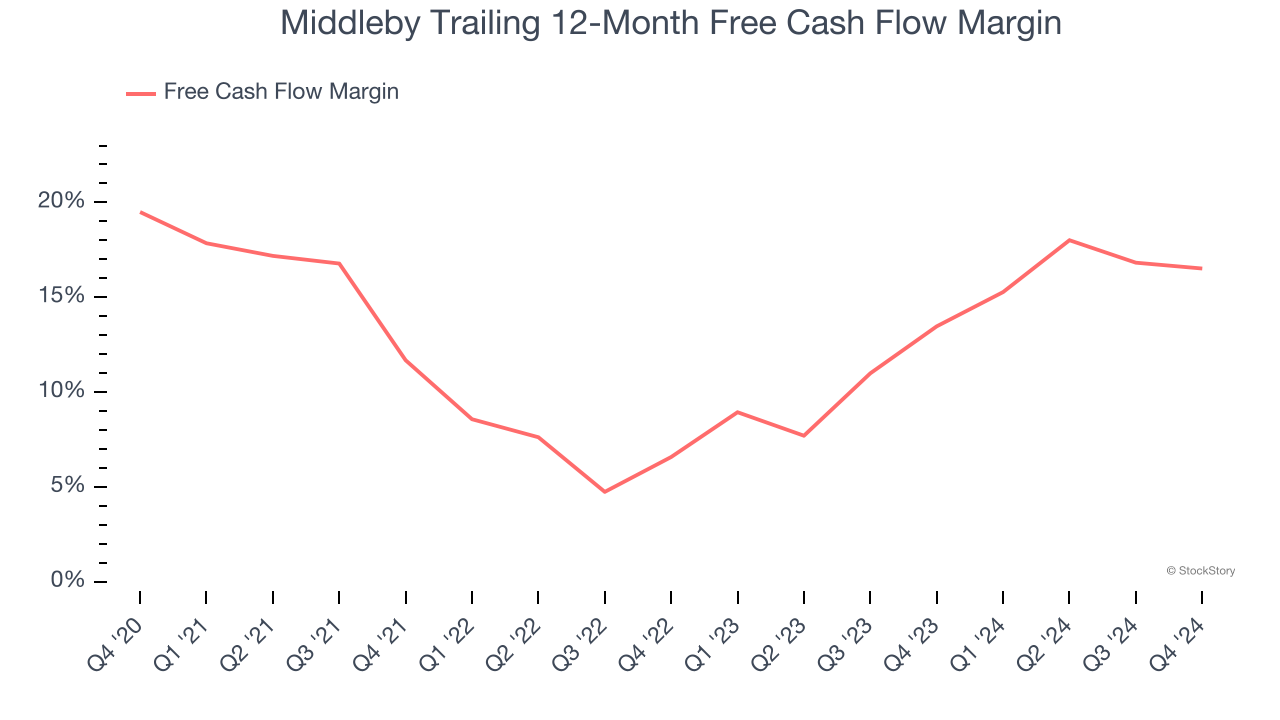
3. Free Cash Flow Margin Dropping
If you’ve followed StockStory for a while, you know we emphasize free cash flow. Why, you ask? We believe that in the end, cash is king, and you can’t use accounting profits to pay the bills.
As you can see below, Middleby’s margin dropped by 3 percentage points over the last five years. It may have ticked higher more recently, but shareholders are likely hoping for its margin to at least revert to its historical level. If the longer-term trend returns, it could signal increasing investment needs and capital intensity. Middleby’s free cash flow margin for the trailing 12 months was 16.5%.
Final Judgment
Middleby falls short of our quality standards. With its shares topping the market in recent months, the stock trades at 15.5× forward price-to-earnings (or $157.28 per share). This valuation multiple is fair, but we don’t have much confidence in the company. There are superior stocks to buy right now. We’d suggest looking at one of Charlie Munger’s all-time favorite businesses.
Stocks We Like More Than Middleby
With rates dropping, inflation stabilizing, and the elections in the rearview mirror, all signs point to the start of a new bull run - and we’re laser-focused on finding the best stocks for this upcoming cycle.
Put yourself in the driver’s seat by checking out our Top 6 Stocks for this week. This is a curated list of our High Quality stocks that have generated a market-beating return of 175% over the last five years.
Stocks that made our list in 2019 include now familiar names such as Nvidia (+2,183% between December 2019 and December 2024) as well as under-the-radar businesses like Comfort Systems (+751% five-year return). Find your next big winner with StockStory today for free.


