
Align Technology has gotten torched over the last six months - since September 2024, its stock price has dropped 35.3% to $164.50 per share. This was partly due to its softer quarterly results and may have investors wondering how to approach the situation.
Is there a buying opportunity in Align Technology, or does it present a risk to your portfolio? Check out our in-depth research report to see what our analysts have to say, it’s free.
Even with the cheaper entry price, we're swiping left on Align Technology for now. Here are three reasons why there are better opportunities than ALGN and a stock we'd rather own.
Why Is Align Technology Not Exciting?
Pioneering an alternative to traditional metal braces with nearly invisible plastic aligners, Align Technology (NASDAQ: ALGN) designs and manufactures Invisalign clear aligners, iTero intraoral scanners, and dental CAD/CAM software for orthodontic and restorative treatments.
1. Lackluster Revenue Growth
Long-term growth is the most important, but within healthcare, a stretched historical view may miss new innovations or demand cycles. Align Technology’s recent performance shows its demand has slowed as its annualized revenue growth of 3.5% over the last two years was below its five-year trend. 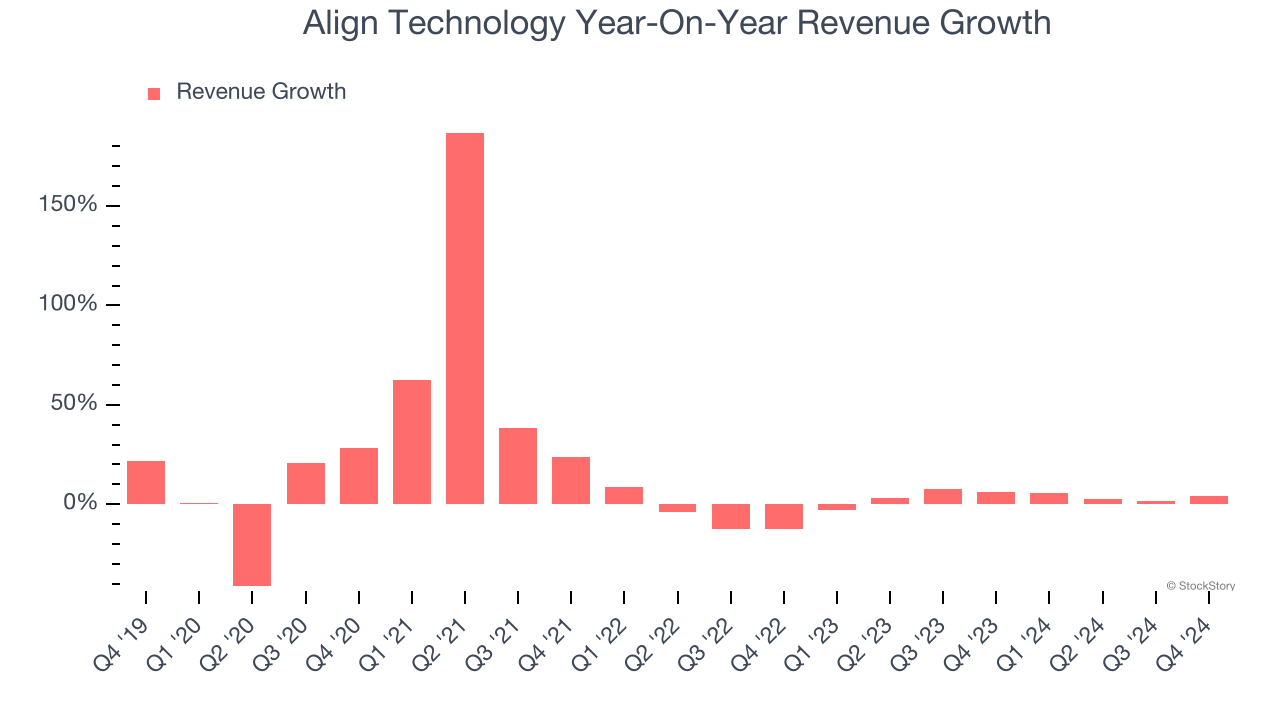
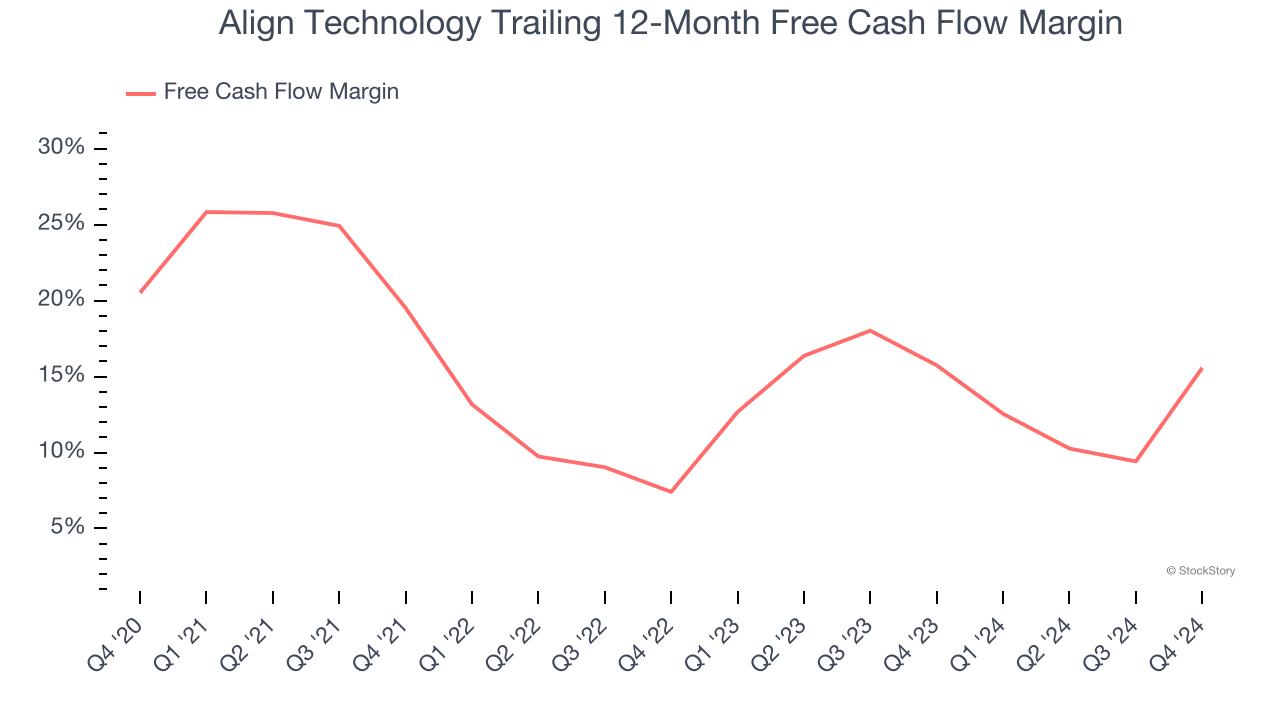
2. Free Cash Flow Margin Dropping
If you’ve followed StockStory for a while, you know we emphasize free cash flow. Why, you ask? We believe that in the end, cash is king, and you can’t use accounting profits to pay the bills.
As you can see below, Align Technology’s margin dropped by 5 percentage points over the last five years. If its declines continue, it could signal increasing investment needs and capital intensity. Align Technology’s free cash flow margin for the trailing 12 months was 15.6%.
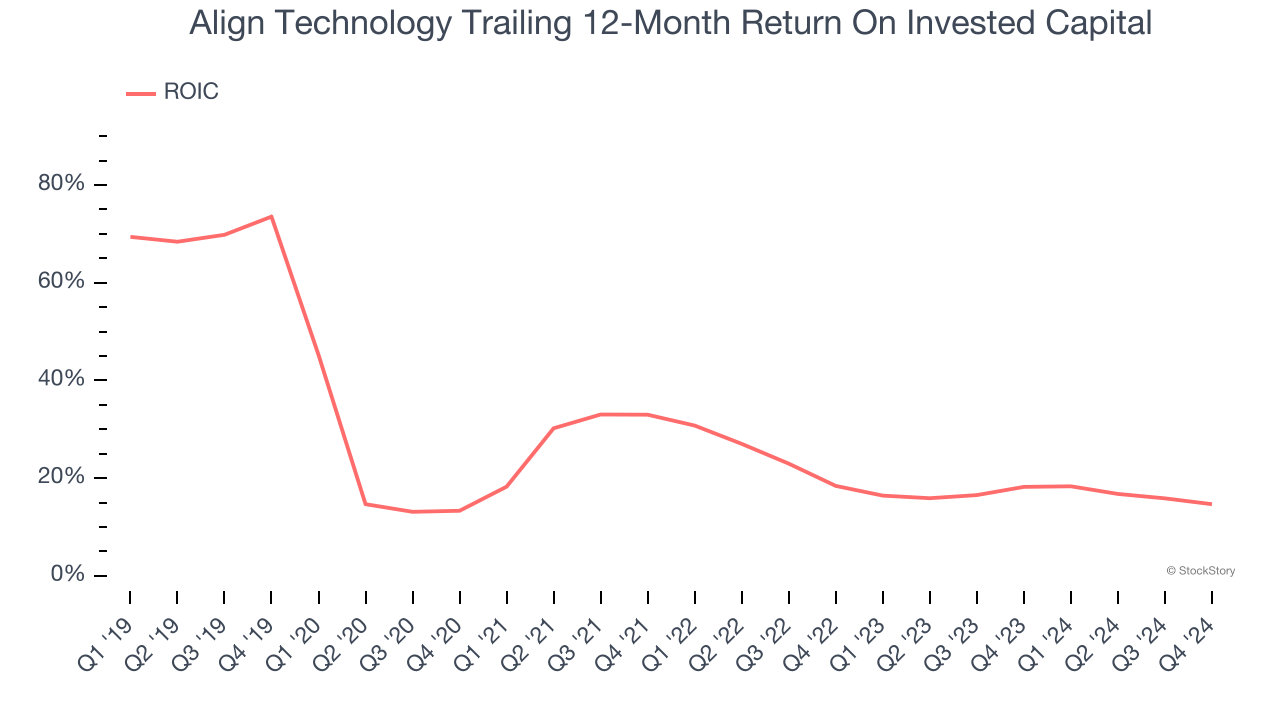
3. New Investments Fail to Bear Fruit as ROIC Declines
ROIC, or return on invested capital, is a metric showing how much operating profit a company generates relative to the money it has raised (debt and equity).
We like to invest in businesses with high returns, but the trend in a company’s ROIC is what often surprises the market and moves the stock price. Unfortunately, Align Technology’s ROIC has decreased over the last few years. We like what management has done in the past, but its declining returns are perhaps a symptom of fewer profitable growth opportunities.
Final Judgment
Align Technology isn’t a terrible business, but it isn’t one of our picks. After the recent drawdown, the stock trades at 16.2× forward price-to-earnings (or $164.50 per share). Investors with a higher risk tolerance might like the company, but we don’t really see a big opportunity at the moment. We're pretty confident there are more exciting stocks to buy at the moment. We’d recommend looking at the Amazon and PayPal of Latin America.
Stocks We Would Buy Instead of Align Technology
The Trump trade may have passed, but rates are still dropping and inflation is still cooling. Opportunities are ripe for those ready to act - and we’re here to help you pick them.
Get started by checking out our Top 5 Growth Stocks for this month. This is a curated list of our High Quality stocks that have generated a market-beating return of 175% over the last five years.
Stocks that made our list in 2019 include now familiar names such as Nvidia (+2,183% between December 2019 and December 2024) as well as under-the-radar businesses like Comfort Systems (+751% five-year return). Find your next big winner with StockStory today for free.


