Content production and distribution company Sphere Entertainment (NYSE: SPHR) reported Q4 CY2024 results exceeding the market’s revenue expectations, but sales fell by 1.9% year on year to $308.3 million. Its GAAP loss of $3.49 per share was 76.7% below analysts’ consensus estimates.
Is now the time to buy Sphere Entertainment? Find out by accessing our full research report, it’s free.
Sphere Entertainment (SPHR) Q4 CY2024 Highlights:
- Revenue: $308.3 million vs analyst estimates of $288.3 million (1.9% year-on-year decline, 6.9% beat)
- EPS (GAAP): -$3.49 vs analyst expectations of -$1.98 (76.7% miss)
- Adjusted EBITDA: -$41.8 million vs analyst estimates of $21 million (-13.6% margin, significant miss)
- Operating Margin: -46.4%, up from -50.8% in the same quarter last year
- Market Capitalization: $1.56 billion
Executive Chairman and CEO James L. Dolan said, "As we enter a new fiscal year, we see significant opportunities to drive our Sphere business forward in Las Vegas and beyond. We believe we are on a path toward realizing our vision for this next-generation medium and generating long-term shareholder value."
Company Overview
Famous for its viral Las Vegas Sphere venue, Sphere Entertainment (NYSE: SPHR) hosts live entertainment events and distributes content across various media platforms.
Leisure Facilities
Leisure facilities companies often sell experiences rather than tangible products, and in the last decade-plus, consumers have slowly shifted their spending from "things" to "experiences". Leisure facilities seek to benefit but must innovate to do so because of the industry's high competition and capital intensity.
Sales Growth
A company’s long-term performance is an indicator of its overall quality. While any business can experience short-term success, top-performing ones enjoy sustained growth for years. Regrettably, Sphere Entertainment’s sales grew at a weak 1.7% compounded annual growth rate over the last five years. This fell short of our benchmarks and is a poor baseline for our analysis.
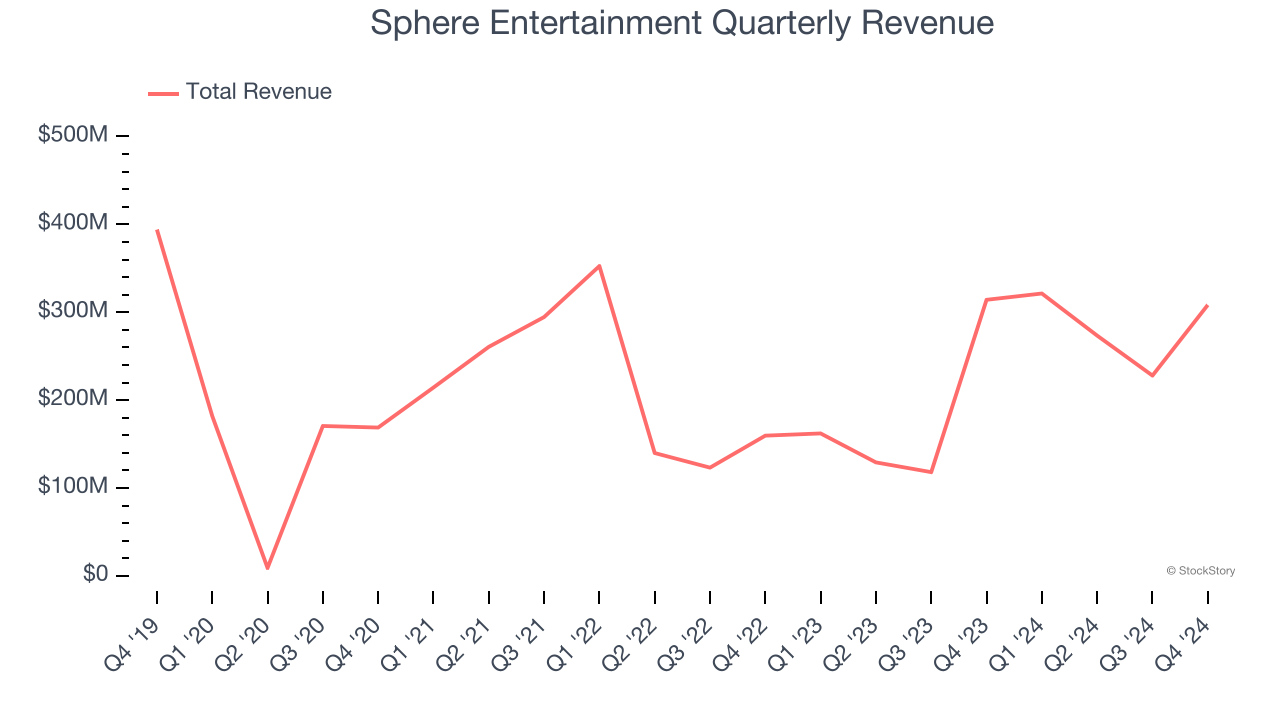
Long-term growth is the most important, but within consumer discretionary, product cycles are short and revenue can be hit-driven due to rapidly changing trends and consumer preferences. Sphere Entertainment’s annualized revenue growth of 20.8% over the last two years is above its five-year trend, suggesting its demand recently accelerated. Note that COVID hurt Sphere Entertainment’s business in 2020 and part of 2021, and it bounced back in a big way thereafter. 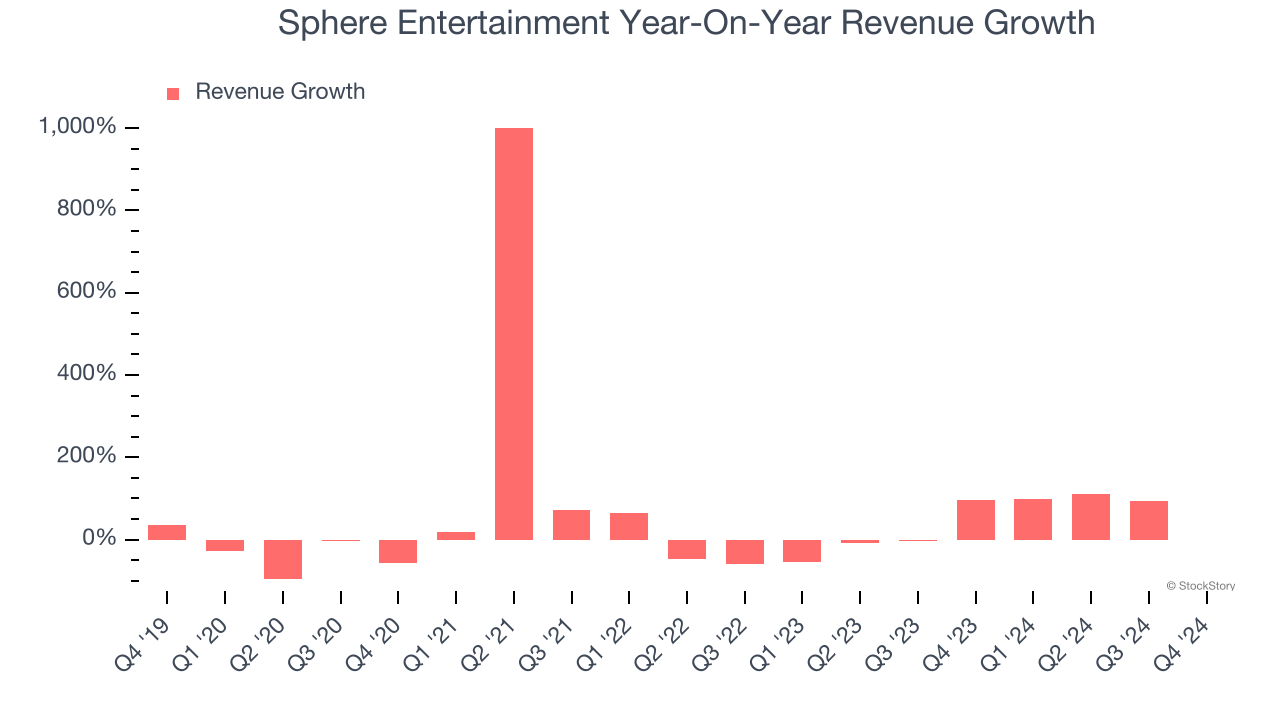
We can dig further into the company’s revenue dynamics by analyzing its most important segments, Sphere and MSG Networks, which are 54.8% and 45.2% of revenue. Over the last two years, Sphere Entertainment’s Sphere revenue (live events and advertising) averaged 11,077% year-on-year growth. On the other hand, its MSG Networks revenue (content distribution) averaged 7.2% declines.
This quarter, Sphere Entertainment’s revenue fell by 1.9% year on year to $308.3 million but beat Wall Street’s estimates by 6.9%.
Looking ahead, sell-side analysts expect revenue to grow 2.7% over the next 12 months, a deceleration versus the last two years. This projection doesn't excite us and implies its products and services will face some demand challenges.
Unless you’ve been living under a rock, it should be obvious by now that generative AI is going to have a huge impact on how large corporations do business. While Nvidia and AMD are trading close to all-time highs, we prefer a lesser-known (but still profitable) stock benefiting from the rise of AI. Click here to access our free report one of our favorites growth stories.
Cash Is King
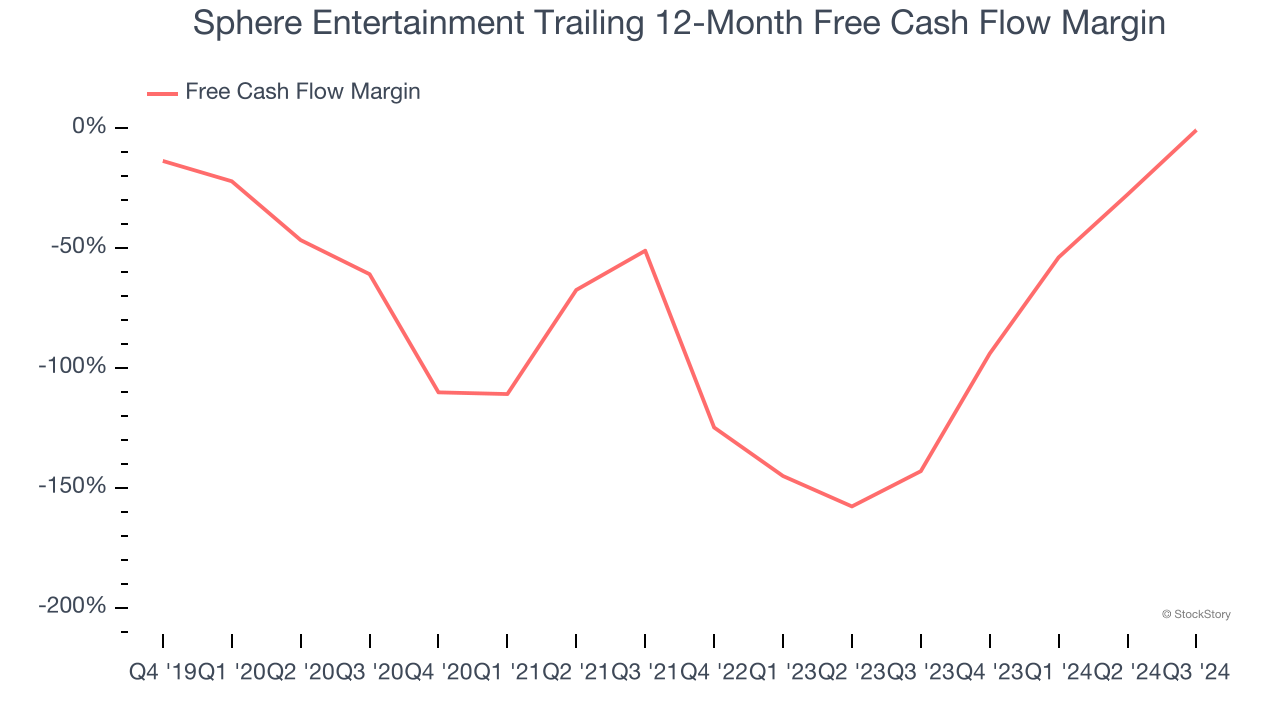
Although earnings are undoubtedly valuable for assessing company performance, we believe cash is king because you can’t use accounting profits to pay the bills.
Over the last two years, Sphere Entertainment’s demanding reinvestments to stay relevant have drained its resources, putting it in a pinch and limiting its ability to return capital to investors. Its free cash flow margin averaged negative 43.4%, meaning it lit $43.36 of cash on fire for every $100 in revenue.
Key Takeaways from Sphere Entertainment’s Q4 Results
We enjoyed seeing Sphere Entertainment beat analysts’ revenue expectations this quarter. We were also glad its Sphere revenue outperformed Wall Street’s estimates. On the other hand, its EBITDA missed significantly and its EPS fell short of Wall Street’s estimates. Overall, this quarter could have been better. The stock remained flat at $44.05 immediately following the results.
Is Sphere Entertainment an attractive investment opportunity right now? We think that the latest quarter is only one piece of the longer-term business quality puzzle. Quality, when combined with valuation, can help determine if the stock is a buy. We cover that in our actionable full research report which you can read here, it’s free.