
Even during a down period for the markets, Confluent has gone against the grain, climbing to $23.71. Its shares have yielded a 16.3% return over the last six months, beating the S&P 500 by 20.5%. This was partly thanks to its solid quarterly results, and the run-up might have investors contemplating their next move.
Following the strength, is CFLT a buy right now? Or is the market overestimating its value? Find out in our full research report, it’s free.
Why Does CFLT Stock Spark Debate?
Started in 2014 by the team of engineers at LinkedIn who originally built it as an internal tool, Confluent (NASDAQ: CFLT) provides infrastructure software for organizations that makes it easy and fast to collect and move large amounts of data between different systems.
Two Things to Like:
1. Billings Surge, Boosting Cash On Hand
Billings is a non-GAAP metric that is often called “cash revenue” because it shows how much money the company has collected from customers in a certain period. This is different from revenue, which must be recognized in pieces over the length of a contract.
Confluent’s billings punched in at $296 million in Q4, and over the last four quarters, its year-on-year growth averaged 26.4%. This performance was fantastic, indicating robust customer demand. The high level of cash collected from customers also enhances liquidity and provides a solid foundation for future investments and growth. 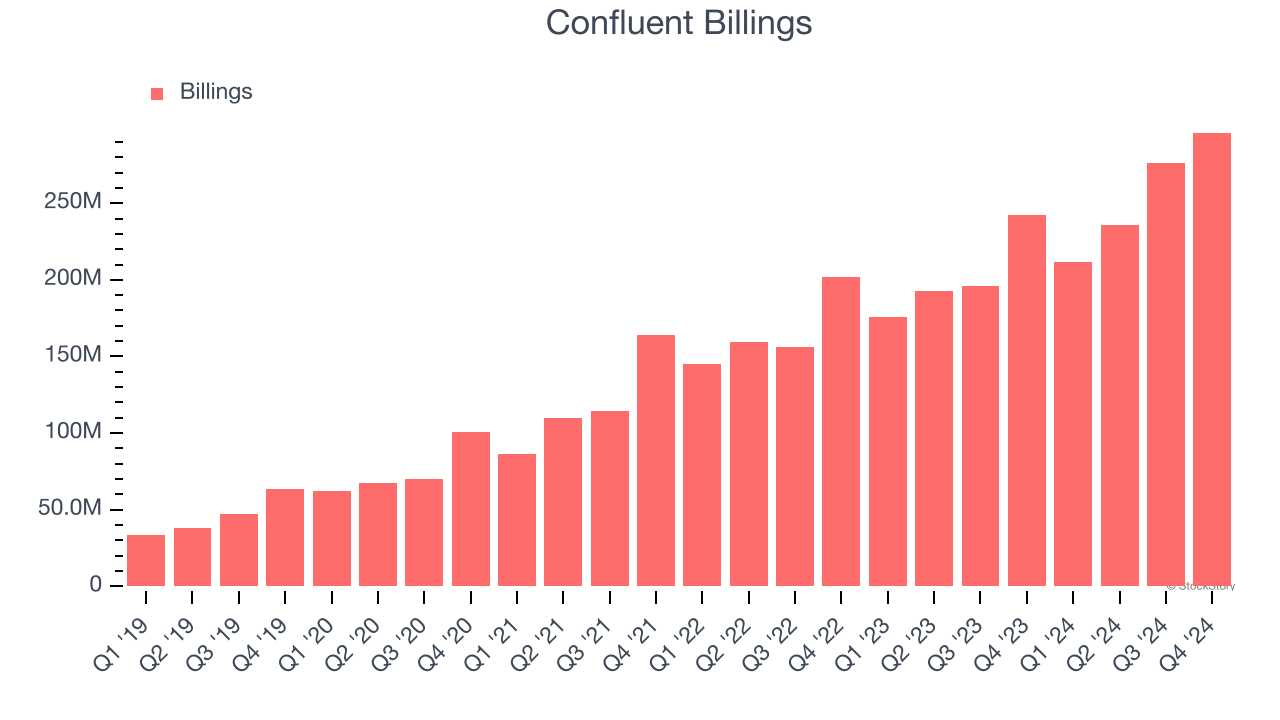
2. Outstanding Retention Sets the Stage for Huge Gains
One of the best parts about the software-as-a-service business model (and a reason why they trade at high valuation multiples) is that customers typically spend more on a company’s products and services over time.
Confluent’s net revenue retention rate, a key performance metric measuring how much money existing customers from a year ago are spending today, was 119% in Q4. This means Confluent would’ve grown its revenue by 18.8% even if it didn’t win any new customers over the last 12 months.
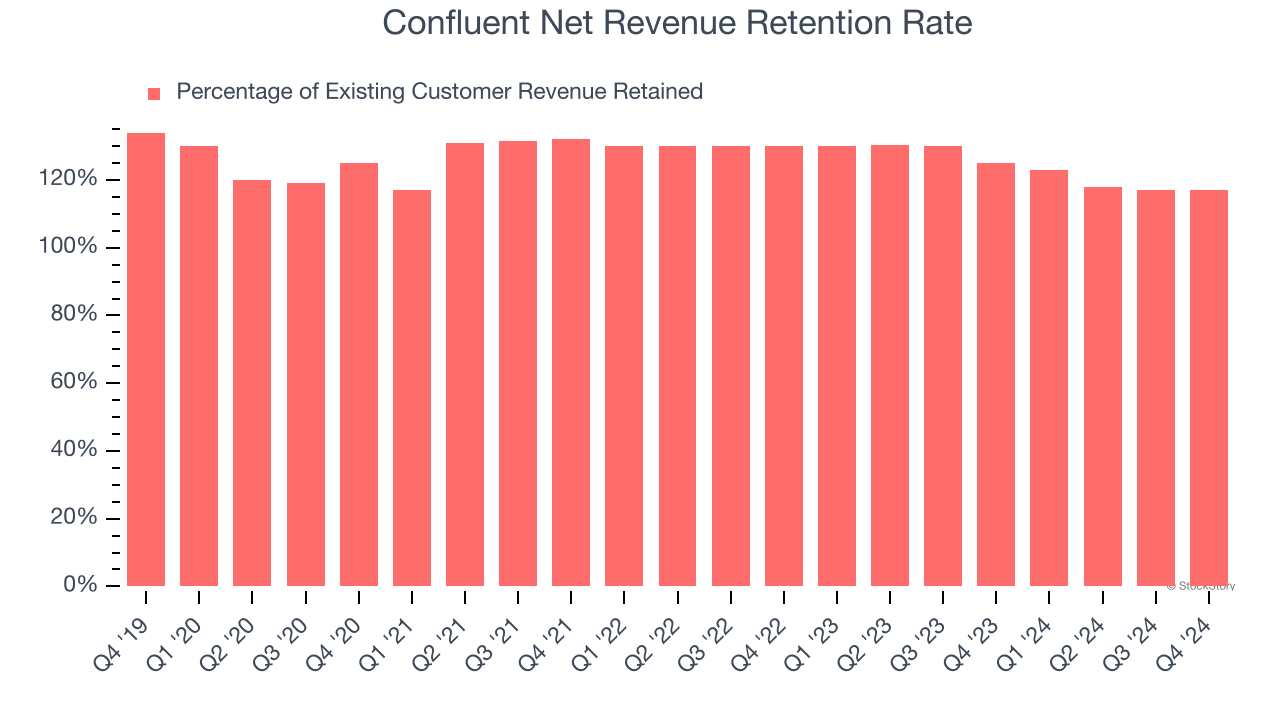
Despite falling over the last year, Confluent still has a good net retention rate, proving that customers are satisfied with its software and getting more value from it over time, which is always great to see.
One Reason to be Careful:
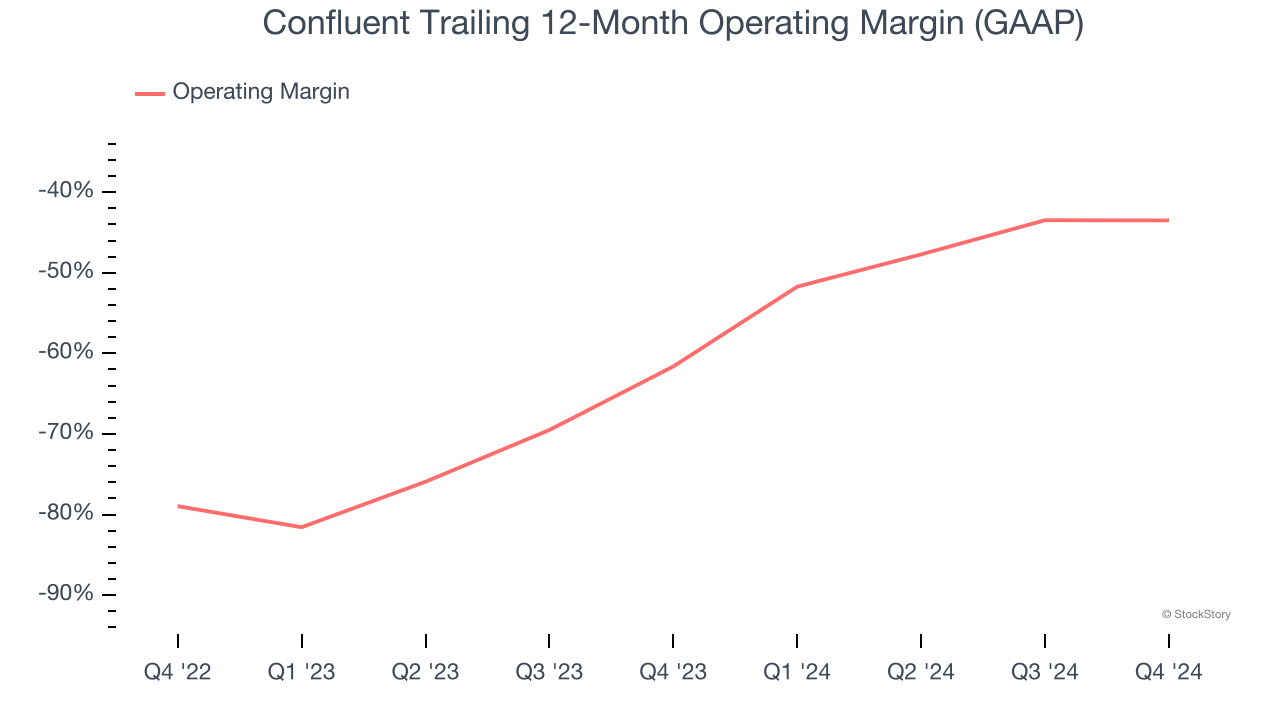
Operating Losses Sound the Alarms
Many software businesses adjust their profits for stock-based compensation (SBC), but we prioritize GAAP operating margin because SBC is a real expense used to attract and retain engineering and sales talent. This is one of the best measures of profitability because it shows how much money a company takes home after developing, marketing, and selling its products.
Confluent’s expensive cost structure has contributed to an average operating margin of negative 43.5% over the last year. This happened because the company spent loads of money to capture market share. As seen in its fast revenue growth, the aggressive strategy has paid off so far, and Wall Street’s estimates suggest the party will continue. We tend to agree and believe the business has a good chance of reaching profitability upon scale.
Final Judgment
Confluent has huge potential even though it has some open questions, and with its shares topping the market in recent months, the stock trades at 6.9× forward price-to-sales (or $23.71 per share). Is now the right time to buy? See for yourself in our in-depth research report, it’s free.
Stocks We Like Even More Than Confluent
The elections are now behind us. With rates dropping and inflation cooling, many analysts expect a breakout market - and we’re zeroing in on the stocks that could benefit immensely.
Take advantage of the rebound by checking out our Top 9 Market-Beating Stocks. This is a curated list of our High Quality stocks that have generated a market-beating return of 175% over the last five years.
Stocks that made our list in 2019 include now familiar names such as Nvidia (+2,183% between December 2019 and December 2024) as well as under-the-radar businesses like Comfort Systems (+751% five-year return). Find your next big winner with StockStory today for free.


