
Residential swimming pool manufacturer Latham (NASDAQ: SWIM) beat Wall Street’s revenue expectations in Q4 CY2024, but sales fell by 4% year on year to $87.27 million. The company’s full-year revenue guidance of $550 million at the midpoint came in 3.8% above analysts’ estimates. Its GAAP loss of $0.25 per share was 93.3% below analysts’ consensus estimates.
Is now the time to buy Latham? Find out by accessing our full research report, it’s free.
Latham (SWIM) Q4 CY2024 Highlights:
- Revenue: $87.27 million vs analyst estimates of $85.87 million (4% year-on-year decline, 1.6% beat)
- EPS (GAAP): -$0.25 vs analyst expectations of -$0.13 (93.3% miss)
- Adjusted EBITDA: $3.62 million vs analyst estimates of $3.66 million (4.2% margin, relatively in line)
- Management’s revenue guidance for the upcoming financial year 2025 is $550 million at the midpoint, beating analyst estimates by 3.8% and implying 8.2% growth (vs -9.9% in FY2024)
- EBITDA guidance for the upcoming financial year 2025 is $95 million at the midpoint, above analyst estimates of $90.36 million
- Operating Margin: -14.9%, down from -9.9% in the same quarter last year
- Free Cash Flow was -$98,000, down from $23.33 million in the same quarter last year
- Market Capitalization: $637.1 million
Commenting on the results, Scott Rajeski, President and CEO, said, “This was a year of substantial achievement for Latham Group. Our in-ground pool sales continued to outperform the U.S. in-ground pool market, we succeeded in expanding margins despite lower utilization, and we made investments that have positioned the Company for sales growth and increased profitability in 2025 and beyond."
Company Overview
Started as a family business, Latham (NASDAQ: SWIM) is a global designer and manufacturer of in-ground residential swimming pools and related products.
Leisure Products
Leisure products cover a wide range of goods in the consumer discretionary sector. Maintaining a strong brand is key to success, and those who differentiate themselves will enjoy customer loyalty and pricing power while those who don’t may find themselves in precarious positions due to the non-essential nature of their offerings.
Sales Growth
A company’s long-term performance is an indicator of its overall quality. While any business can experience short-term success, top-performing ones enjoy sustained growth for years. Regrettably, Latham’s sales grew at a sluggish 6% compounded annual growth rate over the last four years. This fell short of our benchmark for the consumer discretionary sector and is a poor baseline for our analysis.
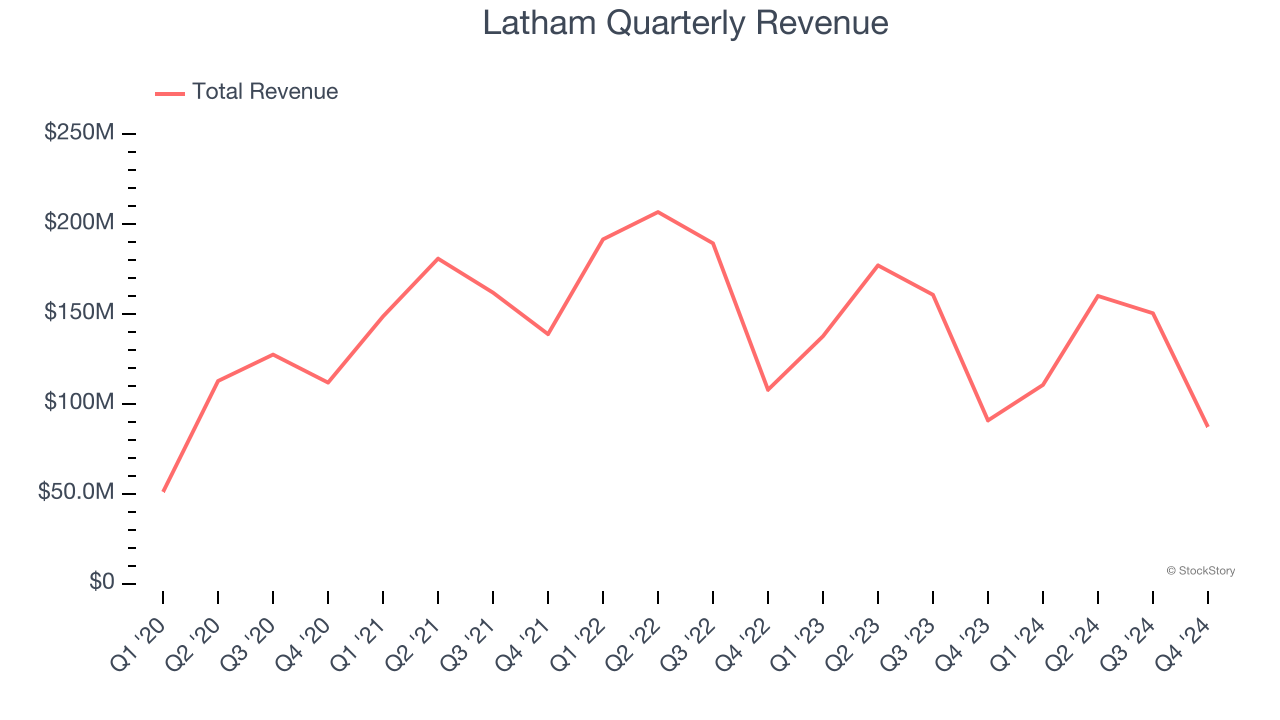
We at StockStory place the most emphasis on long-term growth, but within consumer discretionary, a stretched historical view may miss a company riding a successful new product or trend. Latham’s history shows it grew in the past but relinquished its gains over the last two years, as its revenue fell by 14.5% annually. 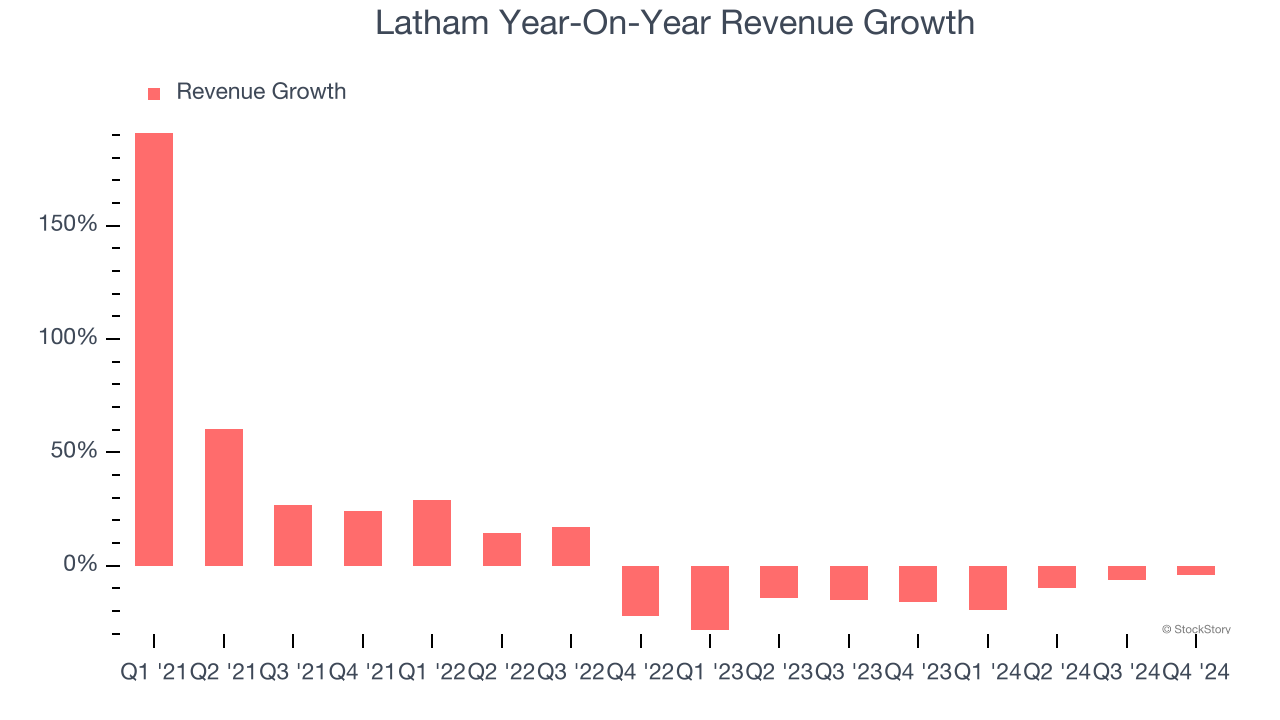
This quarter, Latham’s revenue fell by 4% year on year to $87.27 million but beat Wall Street’s estimates by 1.6%.
Looking ahead, sell-side analysts expect revenue to grow 3.7% over the next 12 months. While this projection implies its newer products and services will fuel better top-line performance, it is still below the sector average.
Software is eating the world and there is virtually no industry left that has been untouched by it. That drives increasing demand for tools helping software developers do their jobs, whether it be monitoring critical cloud infrastructure, integrating audio and video functionality, or ensuring smooth content streaming. Click here to access a free report on our 3 favorite stocks to play this generational megatrend.
Operating Margin
Latham’s operating margin might fluctuated slightly over the last 12 months but has generally stayed the same, averaging 3.2% over the last two years. This profitability was lousy for a consumer discretionary business and caused by its suboptimal cost structure.
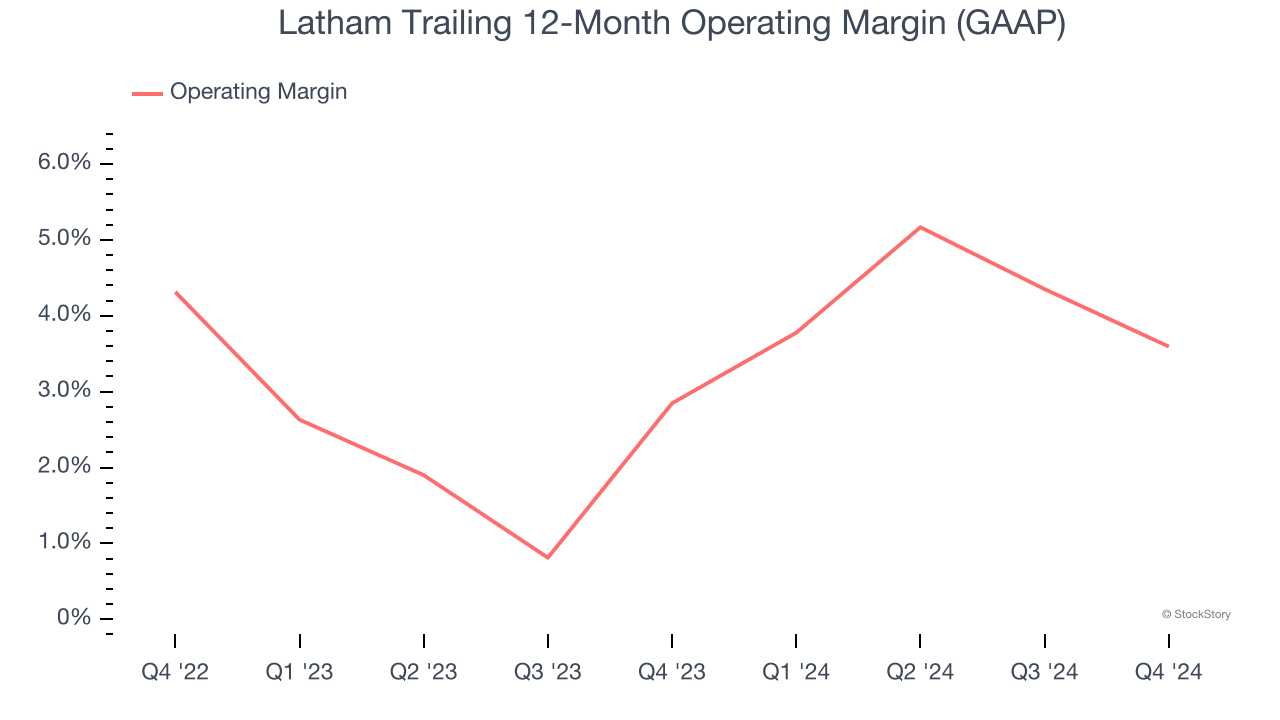
In Q4, Latham generated an operating profit margin of negative 14.9%, down 5 percentage points year on year. This contraction shows it was recently less efficient because its expenses increased relative to its revenue.
Earnings Per Share
Revenue trends explain a company’s historical growth, but the long-term change in earnings per share (EPS) points to the profitability of that growth – for example, a company could inflate its sales through excessive spending on advertising and promotions.
Sadly for Latham, its EPS declined by 29.7% annually over the last four years while its revenue grew by 6%. This tells us the company became less profitable on a per-share basis as it expanded.
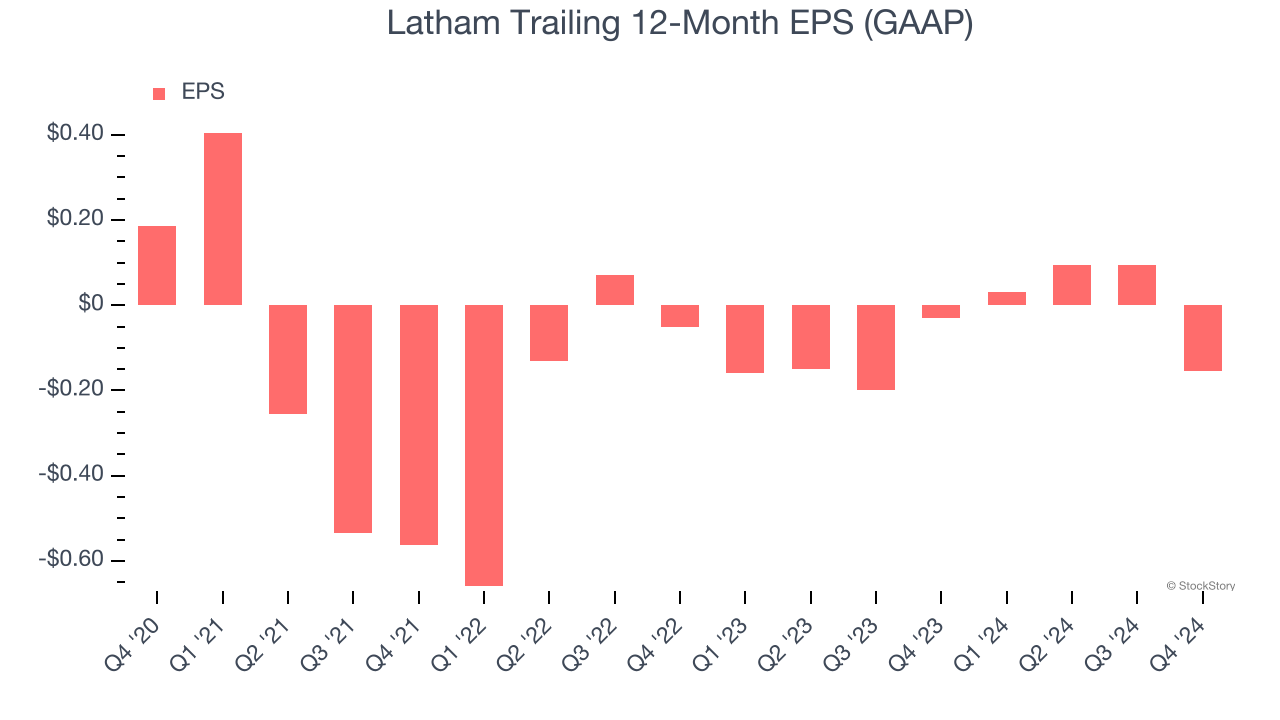
In Q4, Latham reported EPS at negative $0.25, down from $0 in the same quarter last year. This print missed analysts’ estimates. Over the next 12 months, Wall Street is optimistic. Analysts forecast Latham’s full-year EPS of negative $0.15 will reach break even.
Key Takeaways from Latham’s Q4 Results
We were impressed by Latham’s optimistic full-year revenue and EBITDA guidance, which beat past analysts’ expectations. We were also glad its revenue exceeded Wall Street’s estimates. On the other hand, its EPS missed. Still, this quarter had some key positives. The stock traded up 8.1% to $5.90 immediately following the results.
Sure, Latham had a solid quarter, but if we look at the bigger picture, is this stock a buy? If you’re making that decision, you should consider the bigger picture of valuation, business qualities, as well as the latest earnings. We cover that in our actionable full research report which you can read here, it’s free.


