
Over the last six months, QuidelOrtho’s shares have sunk to $40.10, producing a disappointing 7.7% loss - a stark contrast to the S&P 500’s 7.1% gain. This was partly due to its softer quarterly results and might have investors contemplating their next move.
Is there a buying opportunity in QuidelOrtho, or does it present a risk to your portfolio? Check out our in-depth research report to see what our analysts have to say, it’s free.
Despite the more favorable entry price, we don't have much confidence in QuidelOrtho. Here are three reasons why there are better opportunities than QDEL and a stock we'd rather own.
Why Do We Think QuidelOrtho Will Underperform?
Founded in 1979, QuidelOrtho (NASDAQ: QDEL) develops and manufactures diagnostic solutions, focusing on rapid diagnostic tests for infectious diseases, including COVID-19, and other critical conditions.
1. Declining Constant Currency Revenue, Demand Takes a Hit
Investors interested in Medical Devices & Supplies - Imaging, Diagnostics companies should track constant currency revenue in addition to reported revenue. This metric excludes currency movements, which are outside of QuidelOrtho’s control and are not indicative of underlying demand.
Over the last two years, QuidelOrtho’s constant currency revenue averaged 14.2% year-on-year declines. This performance was underwhelming and implies there may be increasing competition or market saturation. It also suggests QuidelOrtho might have to lower prices or invest in product improvements to accelerate growth, factors that can hinder near-term profitability. 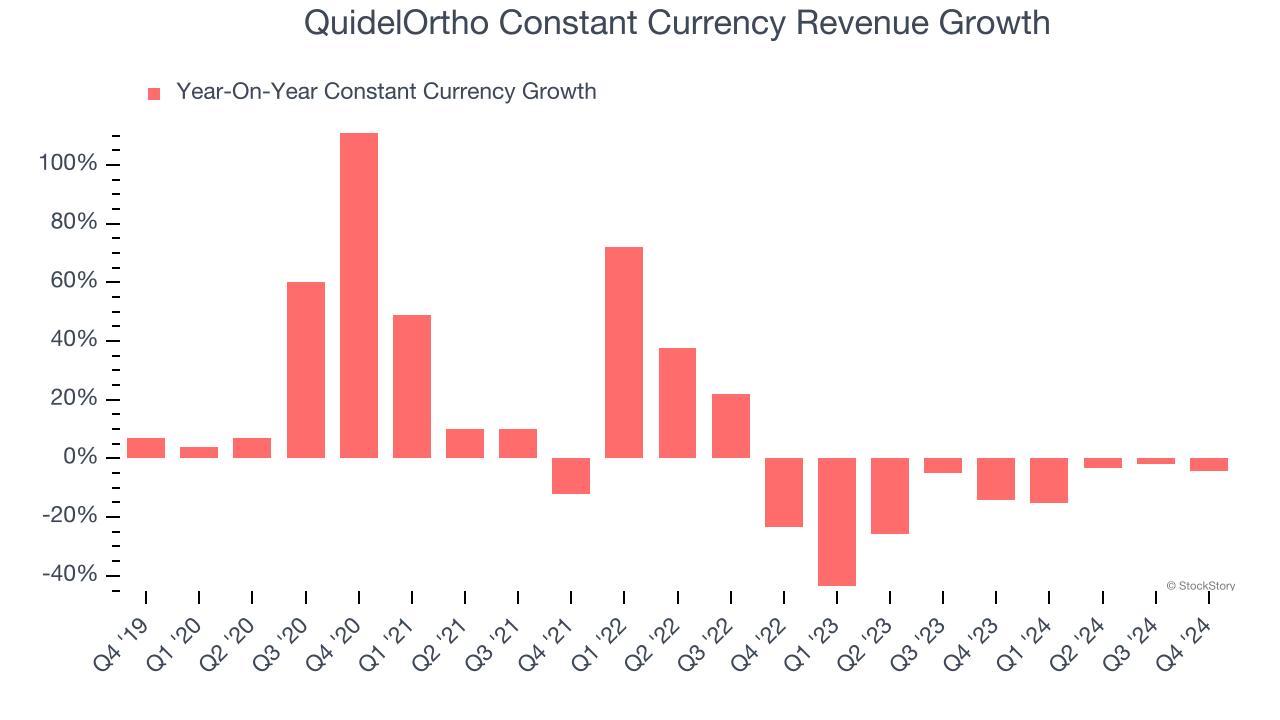
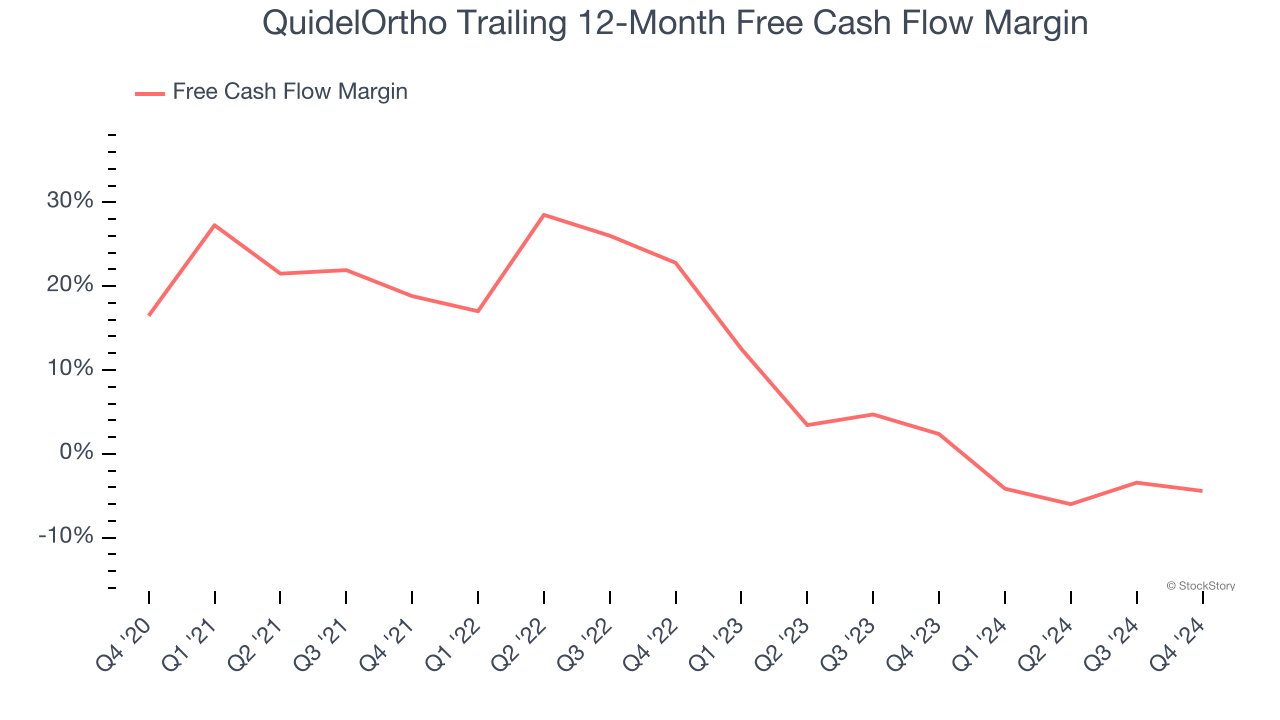
2. Free Cash Flow Margin Dropping
Free cash flow isn't a prominently featured metric in company financials and earnings releases, but we think it's telling because it accounts for all operating and capital expenses, making it tough to manipulate. Cash is king.
As you can see below, QuidelOrtho’s margin dropped by 20.9 percentage points over the last five years. Continued declines could signal it is in the middle of an investment cycle. QuidelOrtho’s free cash flow margin for the trailing 12 months was negative 4.4%.
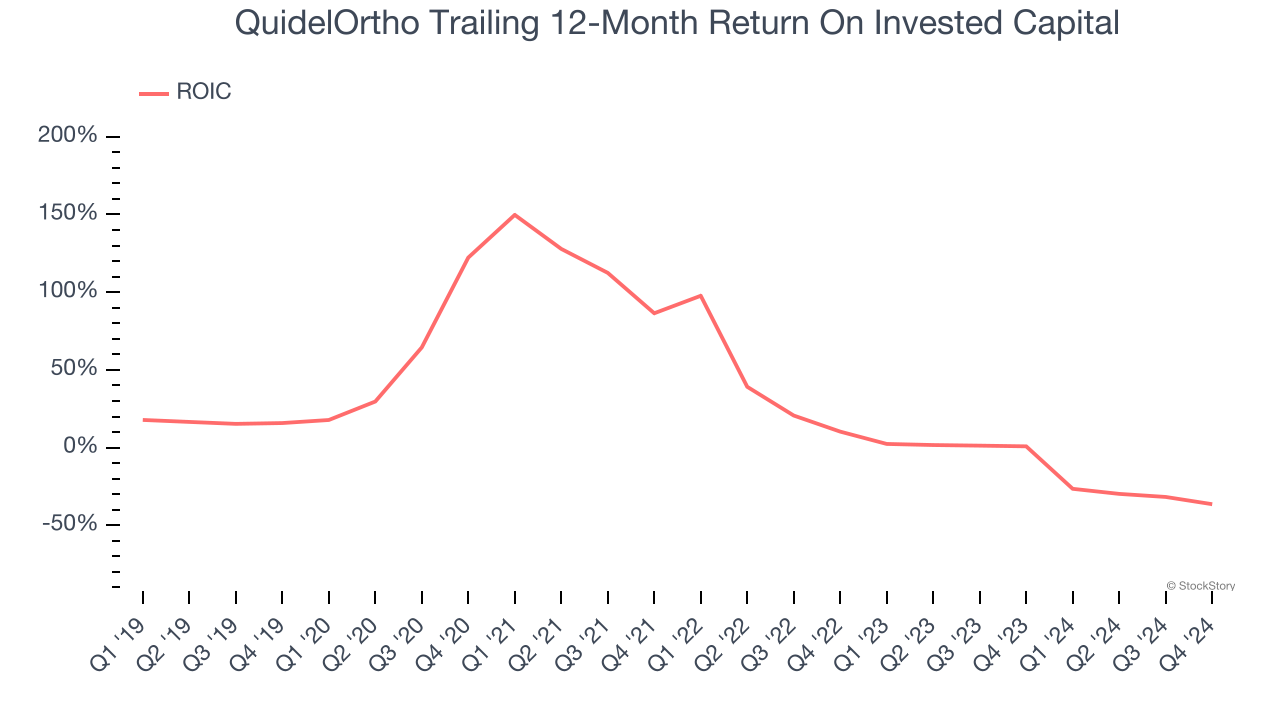
3. New Investments Fail to Bear Fruit as ROIC Declines
A company’s ROIC, or return on invested capital, shows how much operating profit it makes compared to the money it has raised (debt and equity).
We like to invest in businesses with high returns, but the trend in a company’s ROIC is what often surprises the market and moves the stock price. Over the last few years, QuidelOrtho’s ROIC has unfortunately decreased significantly. We like what management has done in the past, but its declining returns are perhaps a symptom of fewer profitable growth opportunities.
Final Judgment
We see the value of companies helping consumers, but in the case of QuidelOrtho, we’re out. Following the recent decline, the stock trades at 16.7× forward price-to-earnings (or $40.10 per share). This valuation tells us a lot of optimism is priced in - we think there are better opportunities elsewhere. Let us point you toward one of our all-time favorite software stocks.
Stocks We Like More Than QuidelOrtho
With rates dropping, inflation stabilizing, and the elections in the rearview mirror, all signs point to the start of a new bull run - and we’re laser-focused on finding the best stocks for this upcoming cycle.
Put yourself in the driver’s seat by checking out our Top 6 Stocks for this week. This is a curated list of our High Quality stocks that have generated a market-beating return of 175% over the last five years.
Stocks that made our list in 2019 include now familiar names such as Nvidia (+2,183% between December 2019 and December 2024) as well as under-the-radar businesses like Sterling Infrastructure (+1,096% five-year return). Find your next big winner with StockStory today for free.
