
What a fantastic six months it’s been for FARO. Shares of the company have skyrocketed 49.1%, hitting $27.08. This was partly thanks to its solid quarterly results, and the performance may have investors wondering how to approach the situation.
Is there a buying opportunity in FARO, or does it present a risk to your portfolio? Check out our in-depth research report to see what our analysts have to say, it’s free.
Despite the momentum, we're cautious about FARO. Here are three reasons why you should be careful with FARO and a stock we'd rather own.
Why Is FARO Not Exciting?
Launched by two PhD students in a garage, FARO (NASDAQ: FARO) provides 3D measurement and imaging systems for the manufacturing, construction, engineering, and public safety industries.
1. Revenue Spiraling Downwards
Reviewing a company’s long-term sales performance reveals insights into its quality. Any business can put up a good quarter or two, but many enduring ones grow for years. FARO struggled to consistently generate demand over the last five years as its sales dropped at a 2.2% annual rate. This wasn’t a great result and signals it’s a lower quality business. 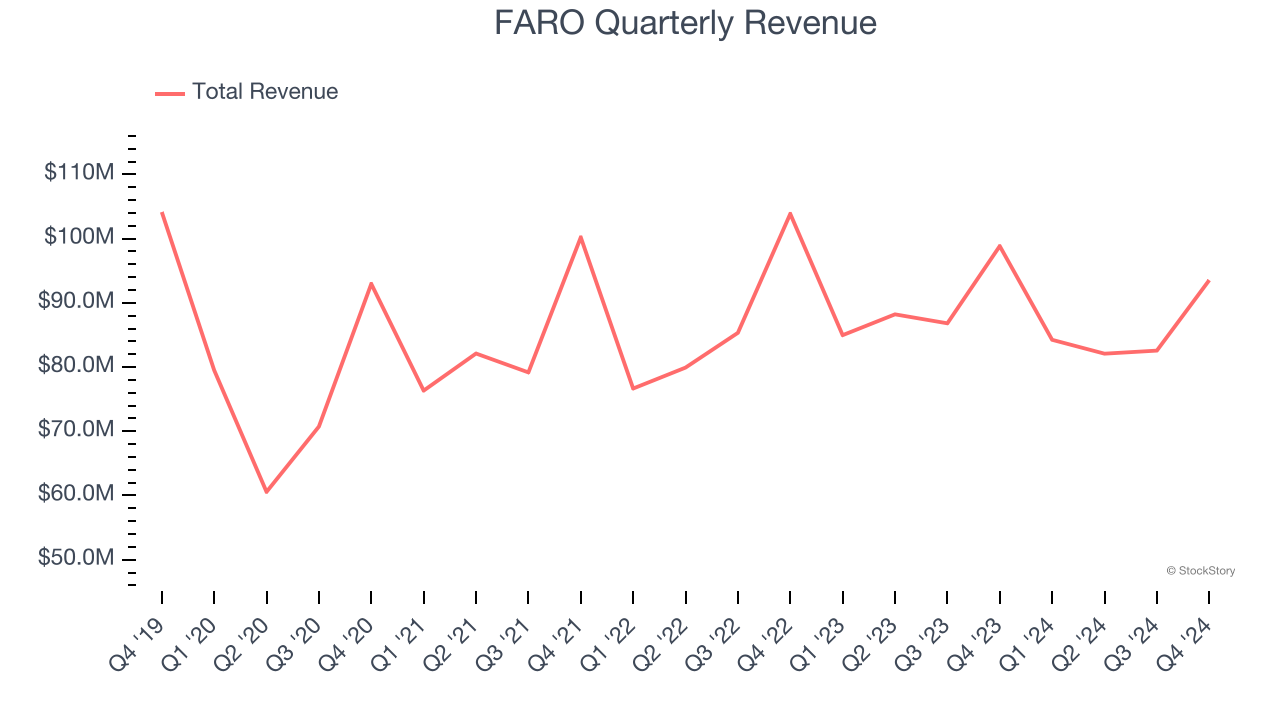
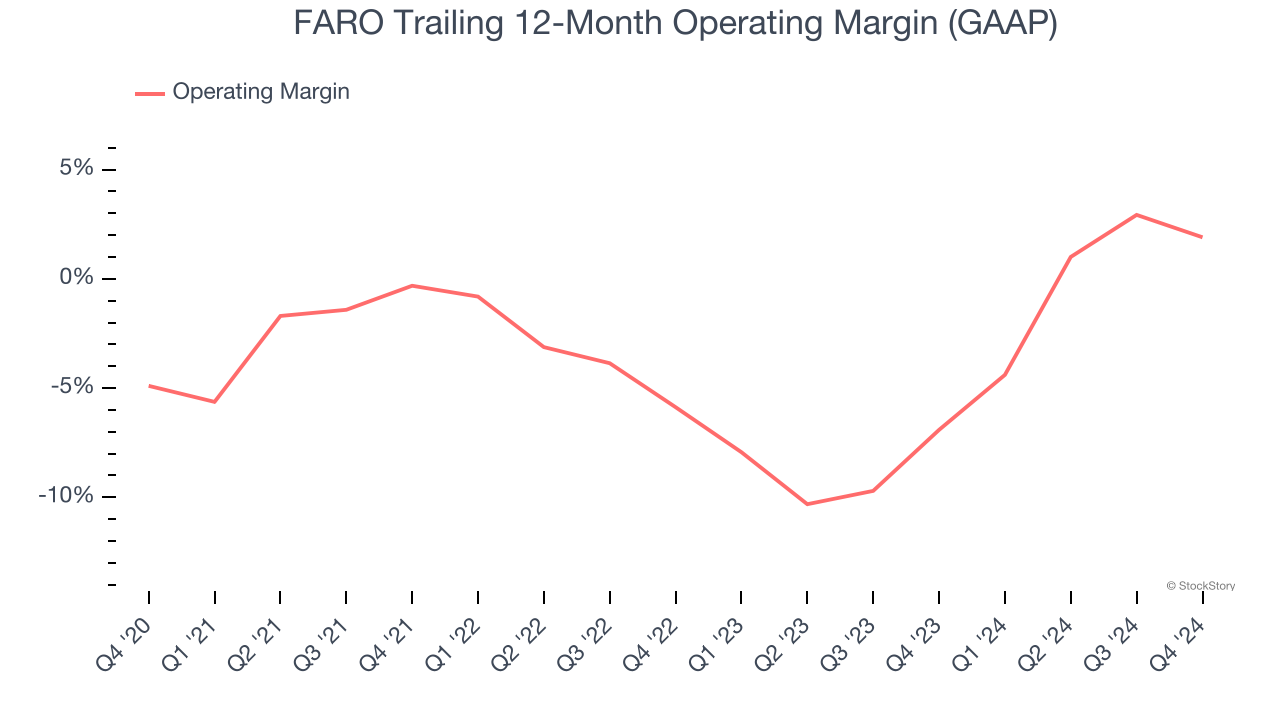
2. Operating Losses Sound the Alarms
Operating margin is a key measure of profitability. Think of it as net income - the bottom line - excluding the impact of taxes and interest on debt, which are less connected to business fundamentals.
Although FARO was profitable this quarter from an operational perspective, it’s generally struggled over a longer time period. Its expensive cost structure has contributed to an average operating margin of negative 3.2% over the last five years. Unprofitable industrials companies require extra attention because they could get caught swimming naked when the tide goes out. It’s hard to trust that the business can endure a full cycle.
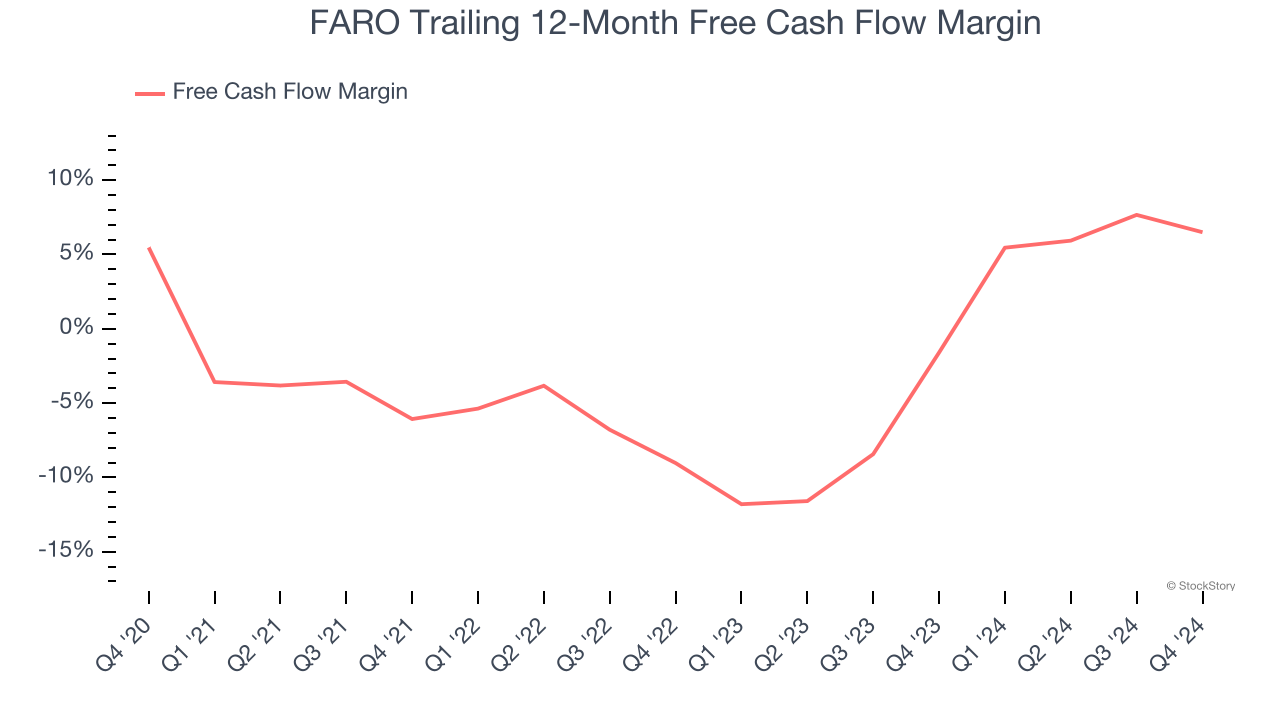
3. Cash Burn Ignites Concerns
Free cash flow isn't a prominently featured metric in company financials and earnings releases, but we think it's telling because it accounts for all operating and capital expenses, making it tough to manipulate. Cash is king.
While FARO posted positive free cash flow this quarter, the broader story hasn’t been so clean. FARO’s demanding reinvestments have drained its resources over the last five years, putting it in a pinch and limiting its ability to return capital to investors. Its free cash flow margin averaged negative 1.1%, meaning it lit $1.10 of cash on fire for every $100 in revenue.
Final Judgment
FARO isn’t a terrible business, but it doesn’t pass our quality test. After the recent rally, the stock trades at 27.4× forward price-to-earnings (or $27.08 per share). This multiple tells us a lot of good news is priced in - you can find better investment opportunities elsewhere. We’d suggest looking at the Amazon and PayPal of Latin America.
Stocks We Like More Than FARO
The Trump trade may have passed, but rates are still dropping and inflation is still cooling. Opportunities are ripe for those ready to act - and we’re here to help you pick them.
Get started by checking out our Top 6 Stocks for this week. This is a curated list of our High Quality stocks that have generated a market-beating return of 175% over the last five years.
Stocks that made our list in 2019 include now familiar names such as Nvidia (+2,183% between December 2019 and December 2024) as well as under-the-radar businesses like Sterling Infrastructure (+1,096% five-year return). Find your next big winner with StockStory today for free.


