
What a brutal six months it’s been for SunOpta. The stock has dropped 22% and now trades at $5.02, rattling many shareholders. This may have investors wondering how to approach the situation.
Is there a buying opportunity in SunOpta, or does it present a risk to your portfolio? Check out our in-depth research report to see what our analysts have to say, it’s free.
Even with the cheaper entry price, we're cautious about SunOpta. Here are three reasons why you should be careful with STKL and a stock we'd rather own.
Why Is SunOpta Not Exciting?
Committed to clean-label foods, SunOpta (NASDAQ: STKL) is a sustainability-focused food and beverage company specializing in the sourcing, processing, and packaging of organic products.
1. Revenue Spiraling Downwards
Reviewing a company’s long-term sales performance reveals insights into its quality. Even a bad business can shine for one or two quarters, but a top-tier one grows for years. SunOpta’s demand was weak over the last three years as its sales fell at a 3.8% annual rate. This wasn’t a great result and signals it’s a lower quality business. 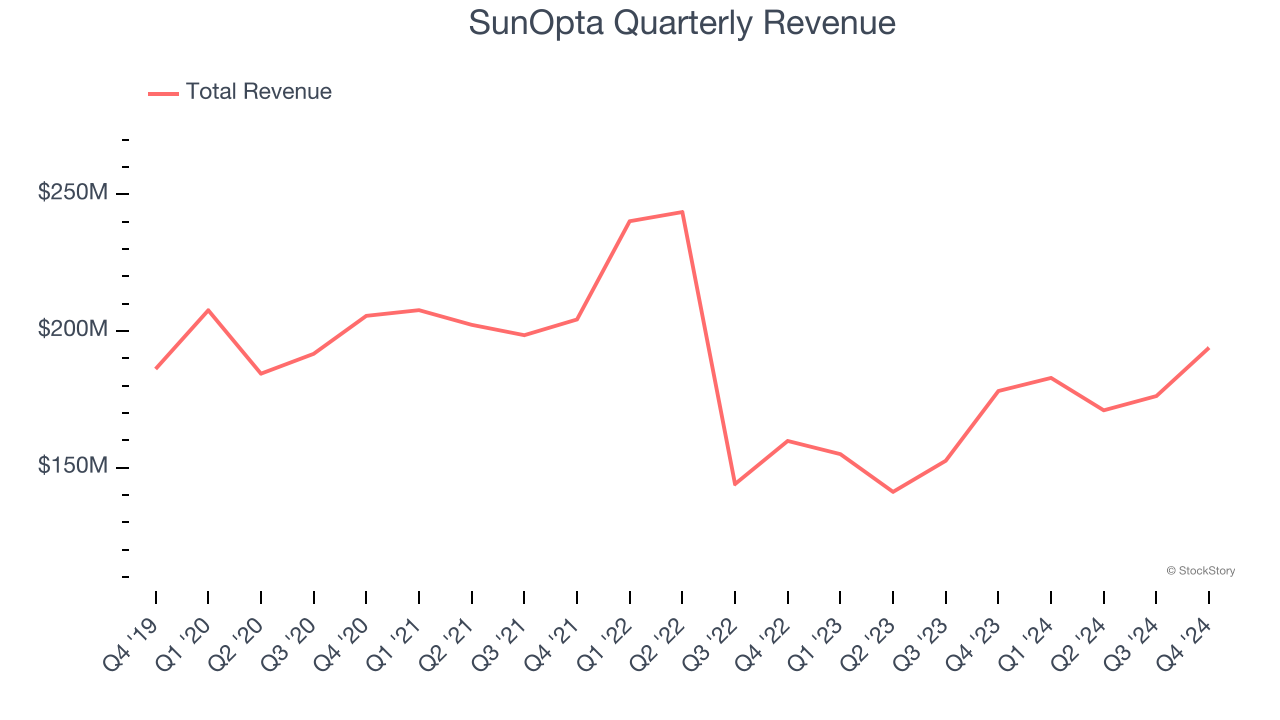
2. Fewer Distribution Channels Limit its Ceiling
With $724 million in revenue over the past 12 months, SunOpta is a small consumer staples company, which sometimes brings disadvantages compared to larger competitors benefiting from economies of scale and negotiating leverage with retailers.
3. Low Gross Margin Reveals Weak Structural Profitability
All else equal, we prefer higher gross margins because they make it easier to generate more operating profits and indicate that a company commands pricing power by offering more differentiated products.
SunOpta has bad unit economics for a consumer staples company, signaling it operates in a competitive market and lacks pricing power because its products can be substituted. As you can see below, it averaged a 16.6% gross margin over the last two years. That means SunOpta paid its suppliers a lot of money ($83.41 for every $100 in revenue) to run its business. 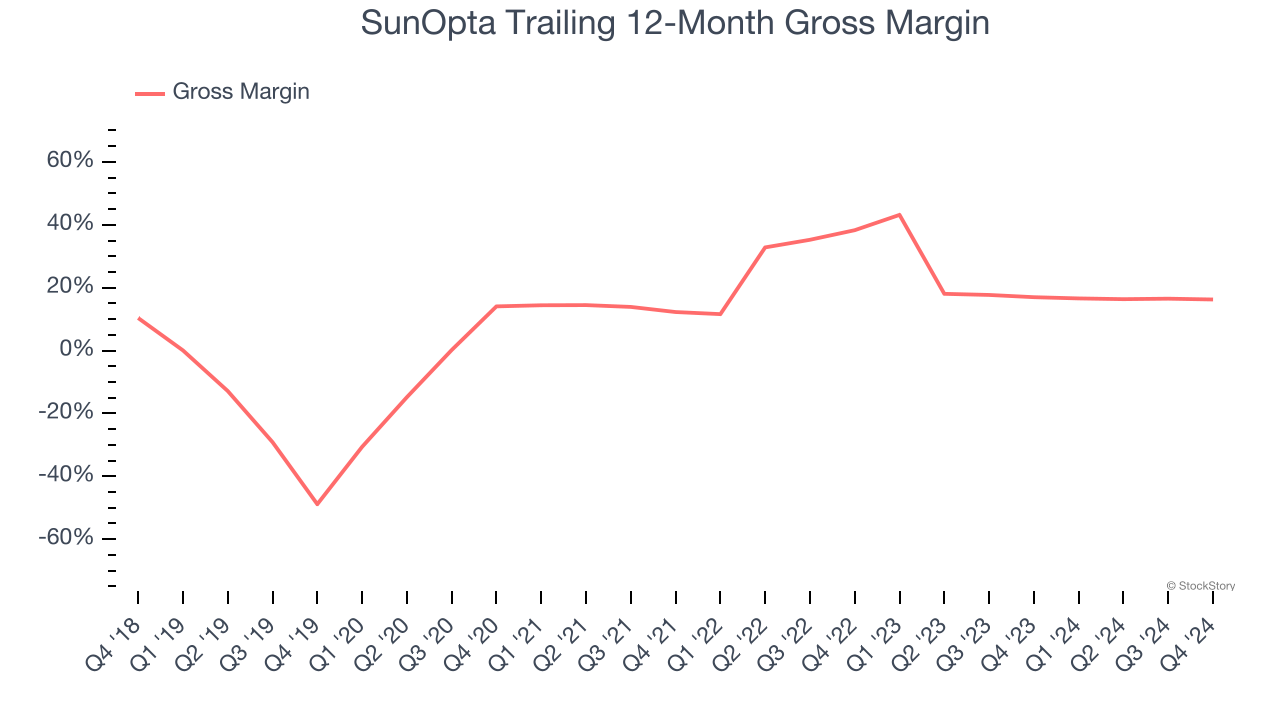
Final Judgment
SunOpta’s business quality ultimately falls short of our standards. Following the recent decline, the stock trades at 18.4× forward price-to-earnings (or $5.02 per share). This valuation tells us it’s a bit of a market darling with a lot of good news priced in - we think there are better stocks to buy right now. We’d recommend looking at the most dominant software business in the world.
Stocks We Like More Than SunOpta
The Trump trade may have passed, but rates are still dropping and inflation is still cooling. Opportunities are ripe for those ready to act - and we’re here to help you pick them.
Get started by checking out our Top 5 Strong Momentum Stocks for this week. This is a curated list of our High Quality stocks that have generated a market-beating return of 175% over the last five years.
Stocks that made our list in 2019 include now familiar names such as Nvidia (+2,183% between December 2019 and December 2024) as well as under-the-radar businesses like Sterling Infrastructure (+1,096% five-year return). Find your next big winner with StockStory today for free.


