
Five9 currently trades at $26.83 per share and has shown little upside over the past six months, posting a small loss of 1.6%.
Is there a buying opportunity in Five9, or does it present a risk to your portfolio? Get the full breakdown from our expert analysts, it’s free.
We don't have much confidence in Five9. Here are three reasons why FIVN doesn't excite us and a stock we'd rather own.
Why Is Five9 Not Exciting?
Started in 2001, Five9 (NASDAQ: FIVN) offers software-as-a-service that makes it easier for companies to set up and efficiently run call centers to offer more tailored customer support.
1. Long-Term Revenue Growth Disappoints
A company’s long-term sales performance can indicate its overall quality. Even a bad business can shine for one or two quarters, but a top-tier one grows for years. Over the last three years, Five9 grew its sales at a 19.6% annual rate. Although this growth is acceptable on an absolute basis, it fell slightly short of our standards for the software sector, which enjoys a number of secular tailwinds. 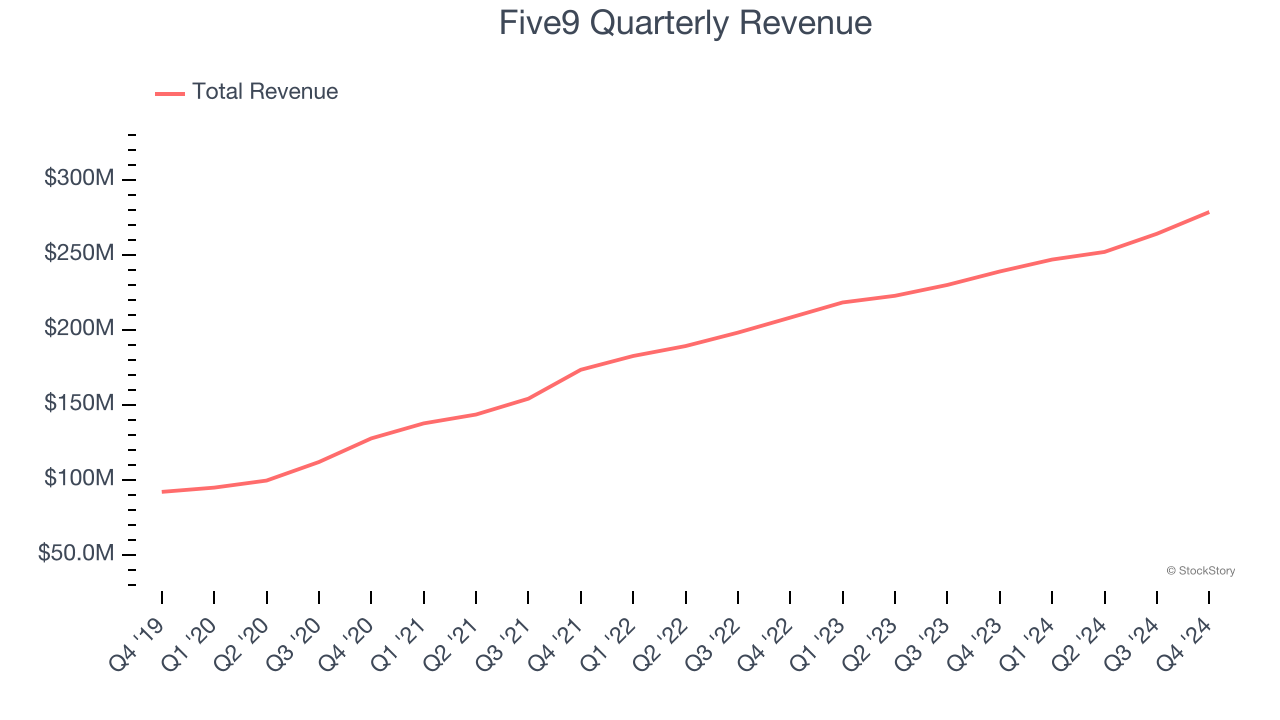
2. Low Gross Margin Reveals Weak Structural Profitability
For software companies like Five9, gross profit tells us how much money remains after paying for the base cost of products and services (typically servers, licenses, and certain personnel). These costs are usually low as a percentage of revenue, explaining why software is more lucrative than other sectors.
Five9’s gross margin is substantially worse than most software businesses, signaling it has relatively high infrastructure costs compared to asset-lite businesses like ServiceNow. As you can see below, it averaged a 54.4% gross margin over the last year. Said differently, Five9 had to pay a chunky $45.63 to its service providers for every $100 in revenue. 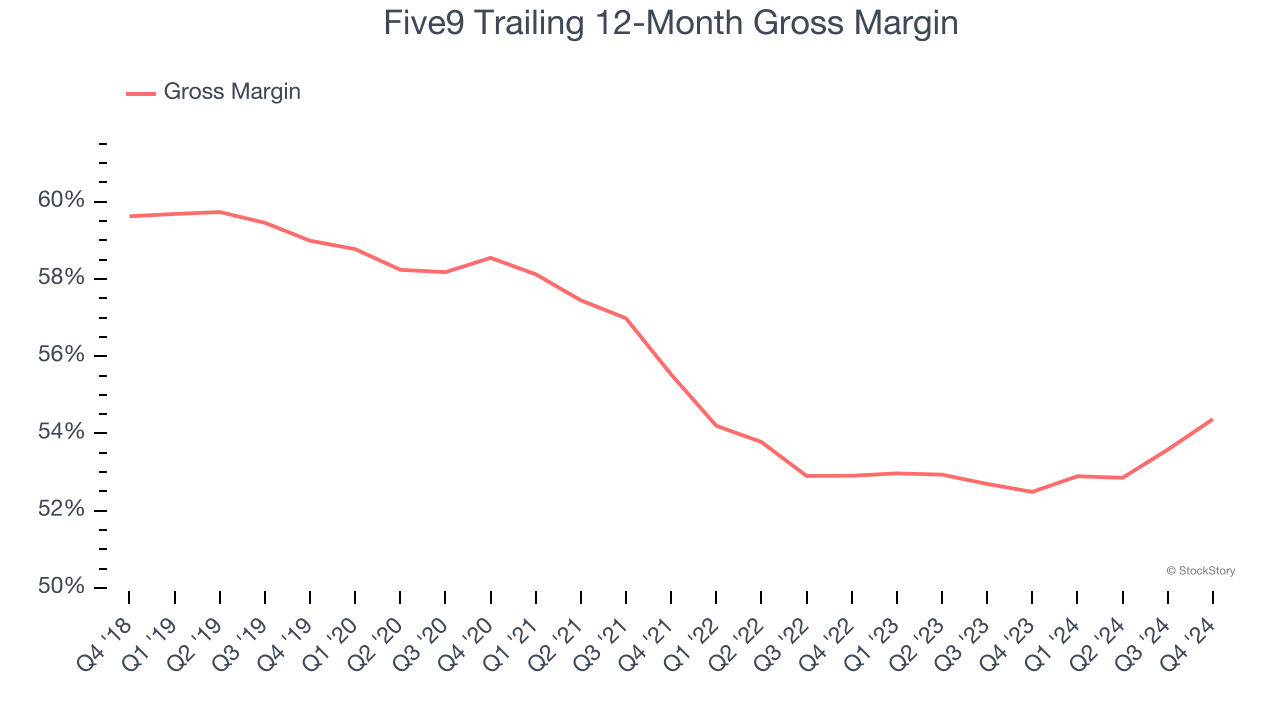
3. Operating Losses Sound the Alarms
While many software businesses point investors to their adjusted profits, which exclude stock-based compensation (SBC), we prefer GAAP operating margin because SBC is a legitimate expense used to attract and retain talent. This metric shows how much revenue remains after accounting for all core expenses – everything from the cost of goods sold to sales and R&D.
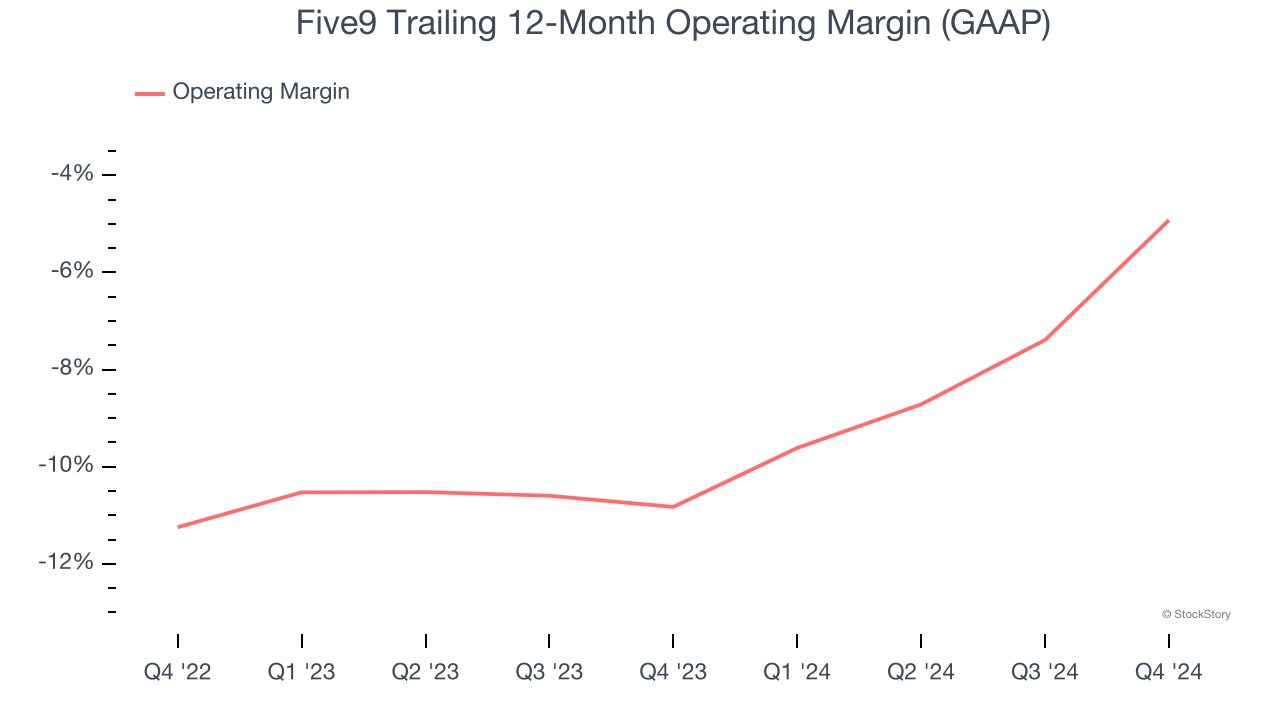
Although Five9 was profitable this quarter from an operational perspective, it’s generally struggled over a longer time period. Its expensive cost structure has contributed to an average operating margin of negative 4.9% over the last year. Unprofitable software companies require extra attention because they spend heaps of money to capture market share. As seen in its historically underwhelming revenue performance, this strategy hasn’t worked so far, and it’s unclear what would happen if Five9 reeled back its investments. Wall Street seems to think it will face some obstacles, and we tend to agree.
Final Judgment
Five9’s business quality ultimately falls short of our standards. That said, the stock currently trades at 2.1× forward price-to-sales (or $26.83 per share). While this valuation is reasonable, we don’t really see a big opportunity at the moment. We're fairly confident there are better stocks to buy right now. Let us point you toward our favorite semiconductor picks and shovels play.
Stocks We Like More Than Five9
With rates dropping, inflation stabilizing, and the elections in the rearview mirror, all signs point to the start of a new bull run - and we’re laser-focused on finding the best stocks for this upcoming cycle.
Put yourself in the driver’s seat by checking out our Top 9 Market-Beating Stocks. This is a curated list of our High Quality stocks that have generated a market-beating return of 175% over the last five years.
Stocks that made our list in 2019 include now familiar names such as Nvidia (+2,183% between December 2019 and December 2024) as well as under-the-radar businesses like Sterling Infrastructure (+1,096% five-year return). Find your next big winner with StockStory today for free.