
iRhythm has been on fire lately. In the past six months alone, the company’s stock price has rocketed 78.8%, reaching $102.62 per share. This was partly thanks to its solid quarterly results, and the run-up might have investors contemplating their next move.
Is there a buying opportunity in iRhythm, or does it present a risk to your portfolio? See what our analysts have to say in our full research report, it’s free.
Despite the momentum, we're sitting this one out for now. Here are three reasons why IRTC doesn't excite us and a stock we'd rather own.
Why Is iRhythm Not Exciting?
Pioneering the shift from bulky, short-term heart monitors to sleek, wire-free patches, iRhythm Technologies (NASDAQ: IRTC) provides wearable cardiac monitoring devices and AI-powered analysis services that help physicians detect and diagnose heart rhythm disorders.
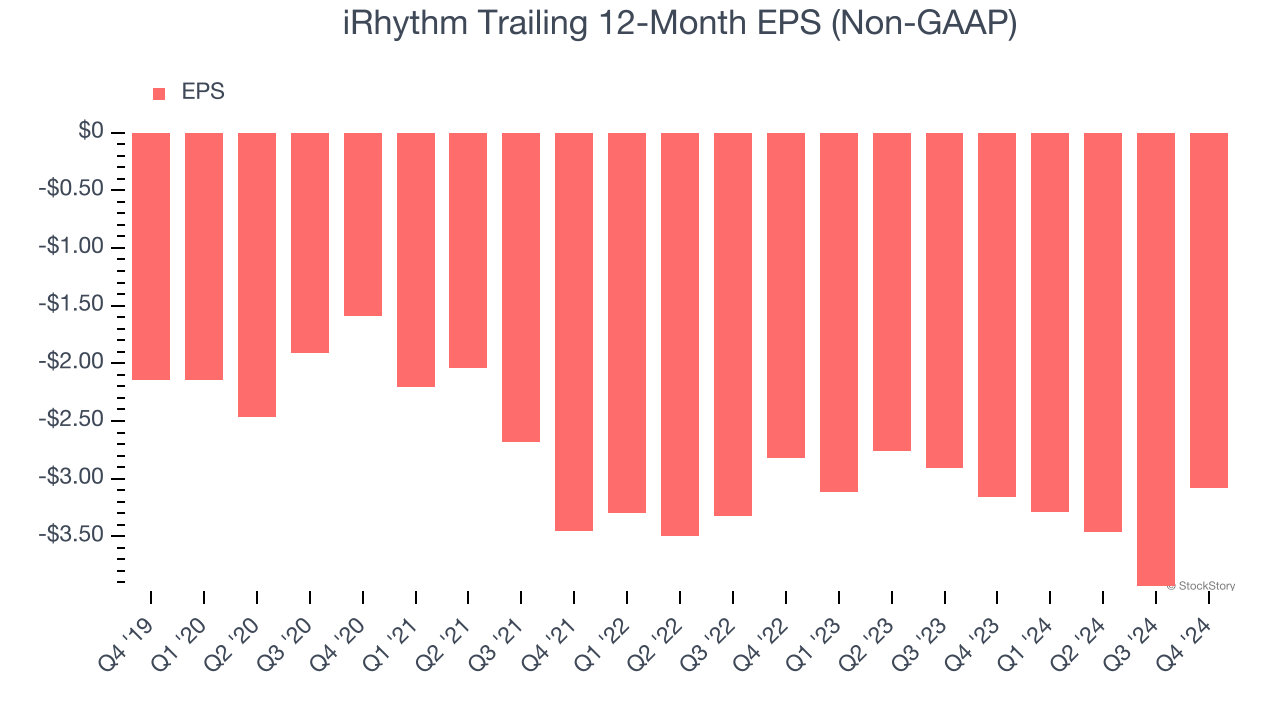
1. EPS Trending Down
We track the long-term change in earnings per share (EPS) because it highlights whether a company’s growth is profitable.
iRhythm’s earnings losses deepened over the last five years as its EPS dropped 7.5% annually. We tend to steer our readers away from companies with falling EPS, where diminishing earnings could imply changing secular trends and preferences. If the tide turns unexpectedly, iRhythm’s low margin of safety could leave its stock price susceptible to large downswings.
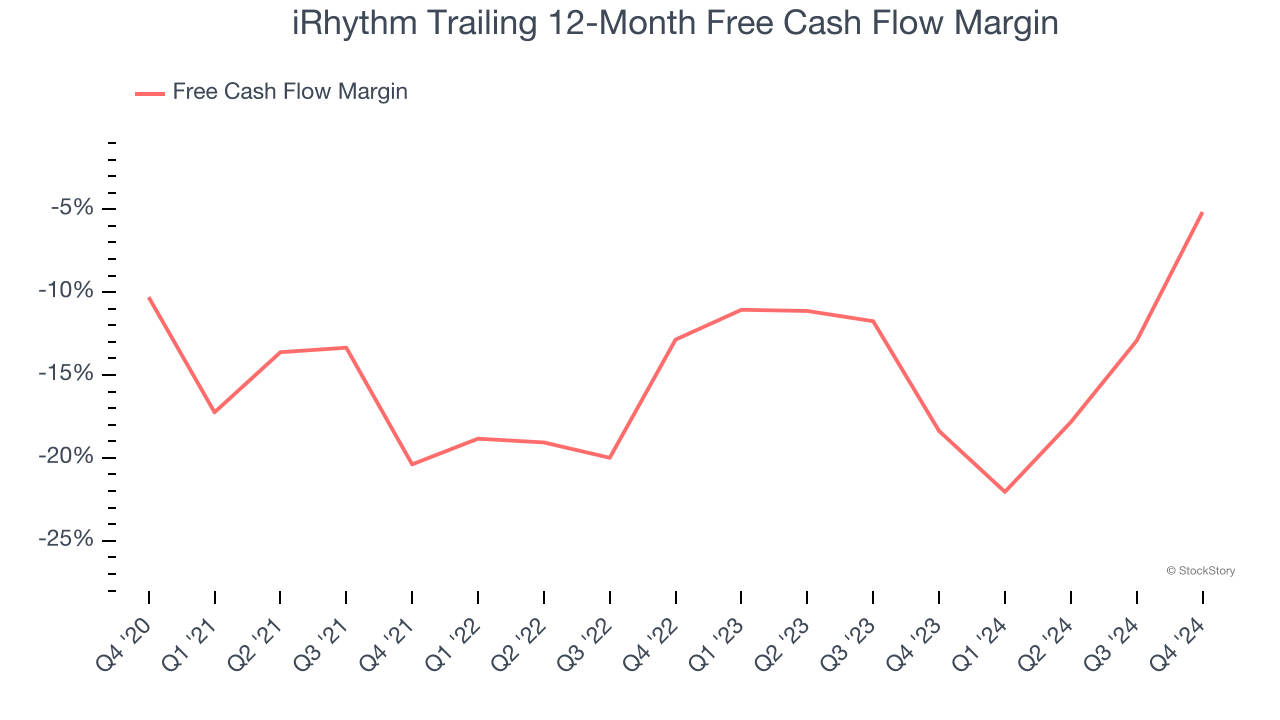
2. Cash Burn Ignites Concerns
If you’ve followed StockStory for a while, you know we emphasize free cash flow. Why, you ask? We believe that in the end, cash is king, and you can’t use accounting profits to pay the bills.
While iRhythm posted positive free cash flow this quarter, the broader story hasn’t been so clean. iRhythm’s demanding reinvestments have consumed many resources over the last five years, contributing to an average free cash flow margin of negative 12.8%. This means it lit $12.82 of cash on fire for every $100 in revenue.
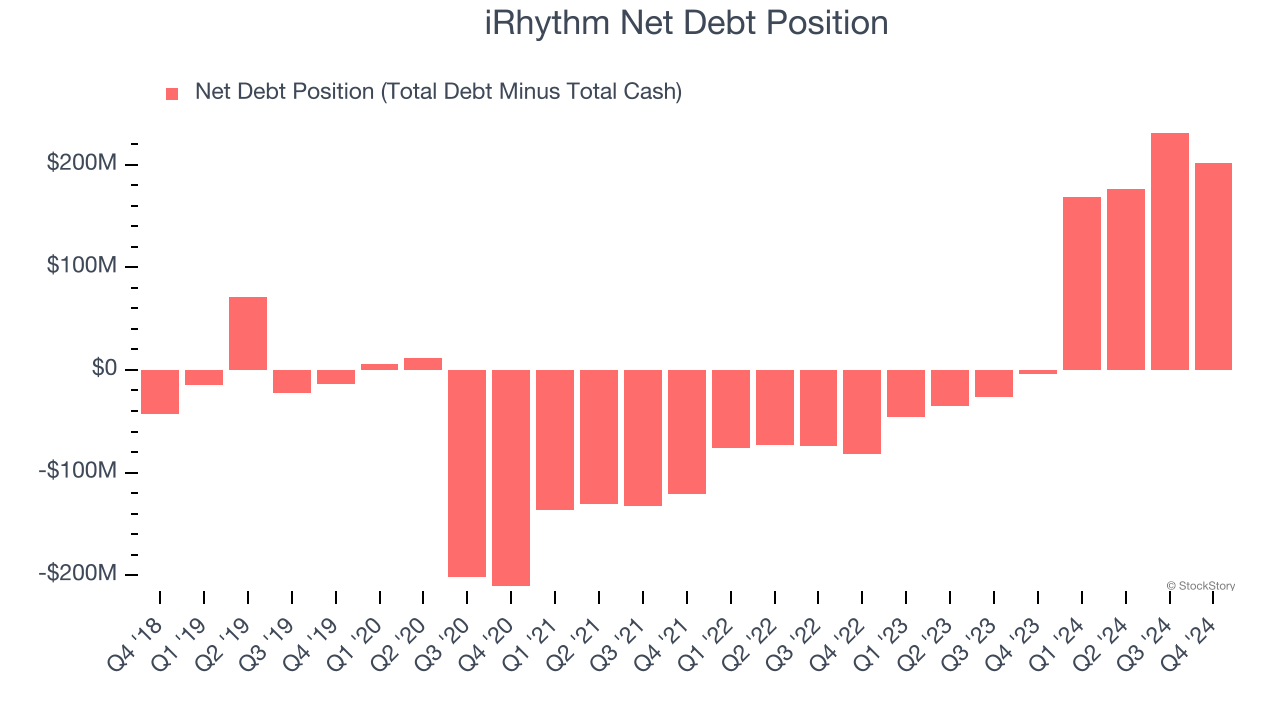
3. Short Cash Runway Exposes Shareholders to Potential Dilution
As long-term investors, the risk we care about most is the permanent loss of capital, which can happen when a company goes bankrupt or raises money from a disadvantaged position. This is separate from short-term stock price volatility, something we are much less bothered by.
iRhythm burned through $30.55 million of cash over the last year, and its $736.9 million of debt exceeds the $535.6 million of cash on its balance sheet. This is a deal breaker for us because indebted loss-making companies spell trouble.
Unless the iRhythm’s fundamentals change quickly, it might find itself in a position where it must raise capital from investors to continue operating. Whether that would be favorable is unclear because dilution is a headwind for shareholder returns.
We remain cautious of iRhythm until it generates consistent free cash flow or any of its announced financing plans materialize on its balance sheet.
Final Judgment
iRhythm’s business quality ultimately falls short of our standards. After the recent rally, the stock trades at 62.3× forward EV-to-EBITDA (or $102.62 per share). This valuation tells us a lot of optimism is priced in - we think there are better opportunities elsewhere. Let us point you toward one of our top software and edge computing picks.
Stocks We Would Buy Instead of iRhythm
Market indices reached historic highs following Donald Trump’s presidential victory in November 2024, but the outlook for 2025 is clouded by new trade policies that could impact business confidence and growth.
While this has caused many investors to adopt a "fearful" wait-and-see approach, we’re leaning into our best ideas that can grow regardless of the political or macroeconomic climate. Take advantage of Mr. Market by checking out our Top 6 Stocks for this week. This is a curated list of our High Quality stocks that have generated a market-beating return of 175% over the last five years.
Stocks that made our list in 2019 include now familiar names such as Nvidia (+2,183% between December 2019 and December 2024) as well as under-the-radar businesses like Sterling Infrastructure (+1,096% five-year return). Find your next big winner with StockStory today for free.