
Hain Celestial has gotten torched over the last six months - since October 2024, its stock price has dropped 58.9% to $3.45 per share. This was partly driven by its softer quarterly results and may have investors wondering how to approach the situation.
Is now the time to buy Hain Celestial, or should you be careful about including it in your portfolio? Dive into our full research report to see our analyst team’s opinion, it’s free.
Despite the more favorable entry price, we're swiping left on Hain Celestial for now. Here are three reasons why there are better opportunities than HAIN and a stock we'd rather own.
Why Do We Think Hain Celestial Will Underperform?
Sold in over 75 countries around the world, Hain Celestial (NASDAQ: HAIN) is a natural and organic food company whose products range from snacks to teas to baby food.
1. Core Business Falling Behind as Demand Declines
When analyzing revenue growth, we care most about organic revenue growth. This metric captures a business’s performance excluding one-time events such as mergers, acquisitions, and divestitures as well as foreign currency fluctuations.
Hain Celestial’s demand has been falling over the last eight quarters, and on average, its organic sales have declined by 3.7% year on year. 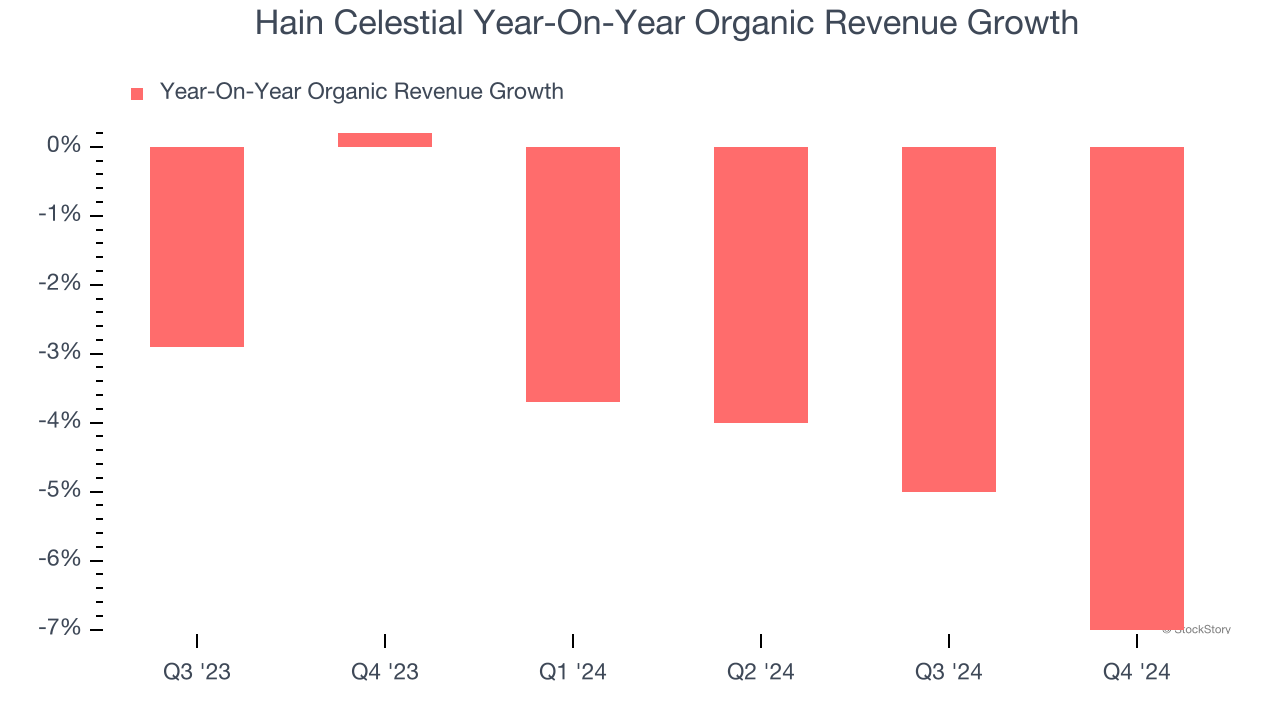
2. Revenue Projections Show Stormy Skies Ahead
Forecasted revenues by Wall Street analysts signal a company’s potential. Predictions may not always be accurate, but accelerating growth typically boosts valuation multiples and stock prices while slowing growth does the opposite.
Over the next 12 months, sell-side analysts expect Hain Celestial’s revenue to drop by 1.7%. While this projection is better than its three-year trend, it's hard to get excited about a company that is struggling with demand.
3. EPS Trending Down
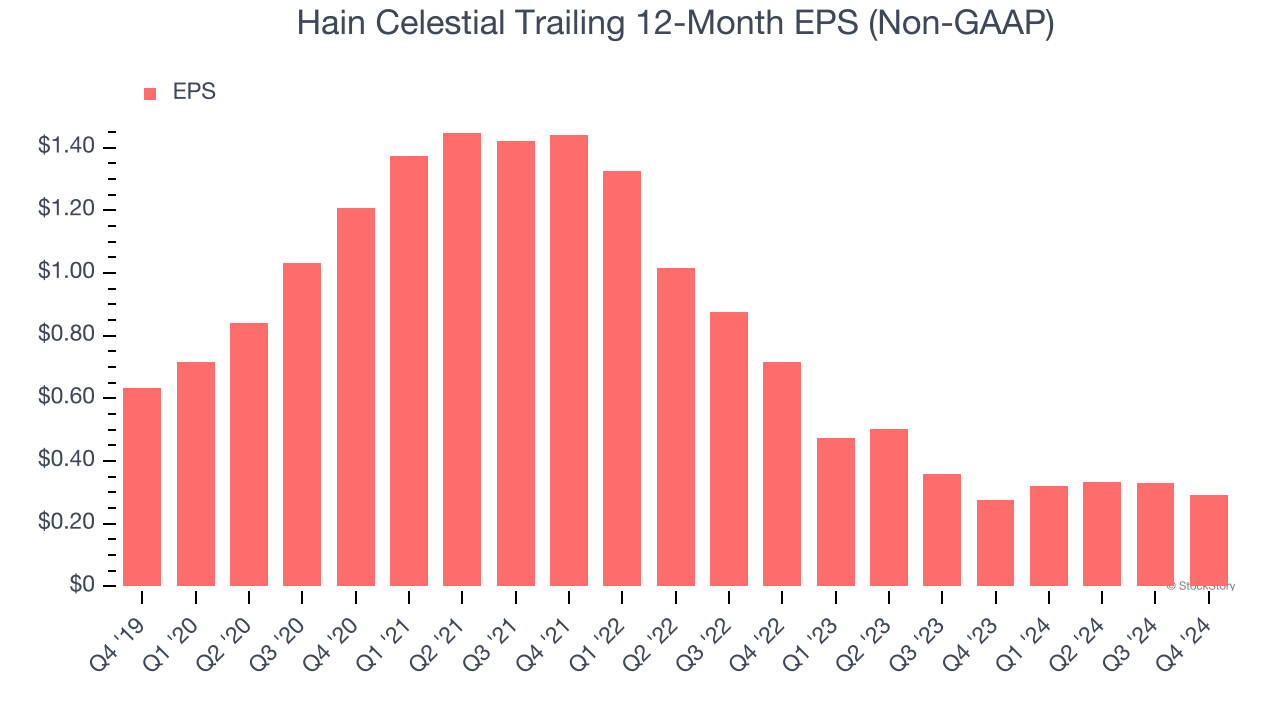
We track the change in earnings per share (EPS) because it highlights whether a company’s growth is profitable.
Sadly for Hain Celestial, its EPS declined by 41.2% annually over the last three years, more than its revenue. This tells us the company struggled because its fixed cost base made it difficult to adjust to shrinking demand.
Final Judgment
Hain Celestial doesn’t pass our quality test. Following the recent decline, the stock trades at 7.1× forward price-to-earnings (or $3.45 per share). While this valuation is optically cheap, the potential downside is huge given its shaky fundamentals. There are more exciting stocks to buy at the moment. Let us point you toward the Amazon and PayPal of Latin America.
Stocks We Like More Than Hain Celestial
Market indices reached historic highs following Donald Trump’s presidential victory in November 2024, but the outlook for 2025 is clouded by new trade policies that could impact business confidence and growth.
While this has caused many investors to adopt a "fearful" wait-and-see approach, we’re leaning into our best ideas that can grow regardless of the political or macroeconomic climate. Take advantage of Mr. Market by checking out our Top 9 Market-Beating Stocks. This is a curated list of our High Quality stocks that have generated a market-beating return of 175% over the last five years.
Stocks that made our list in 2019 include now familiar names such as Nvidia (+2,183% between December 2019 and December 2024) as well as under-the-radar businesses like Comfort Systems (+751% five-year return). Find your next big winner with StockStory today for free.


