
Latham’s stock price has taken a beating over the past six months, shedding 30.2% of its value and falling to $4.85 per share. This may have investors wondering how to approach the situation.
Is there a buying opportunity in Latham, or does it present a risk to your portfolio? Get the full breakdown from our expert analysts, it’s free.
Even with the cheaper entry price, we're cautious about Latham. Here are three reasons why SWIM doesn't excite us and a stock we'd rather own.
Why Is Latham Not Exciting?
Started as a family business, Latham (NASDAQ: SWIM) is a global designer and manufacturer of in-ground residential swimming pools and related products.
1. Long-Term Revenue Growth Disappoints
Reviewing a company’s long-term sales performance reveals insights into its quality. Any business can experience short-term success, but top-performing ones enjoy sustained growth for years. Unfortunately, Latham’s 6% annualized revenue growth over the last four years was sluggish. This fell short of our benchmark for the consumer discretionary sector. 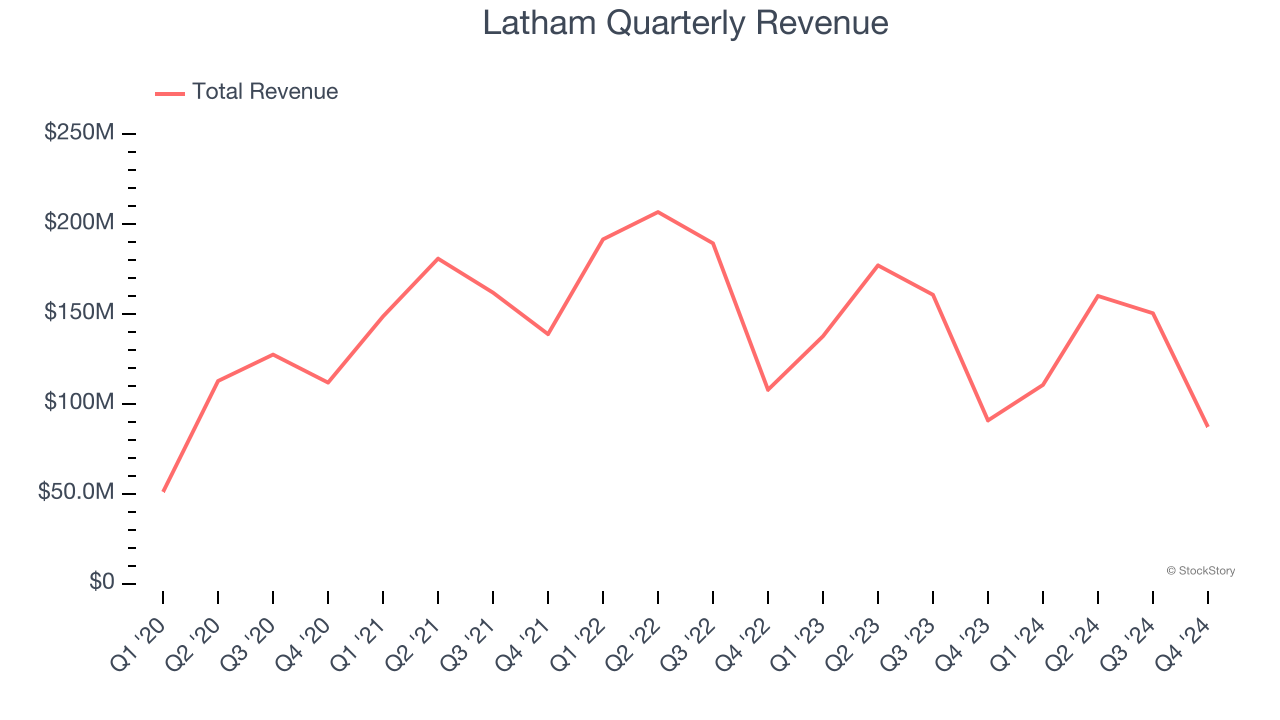
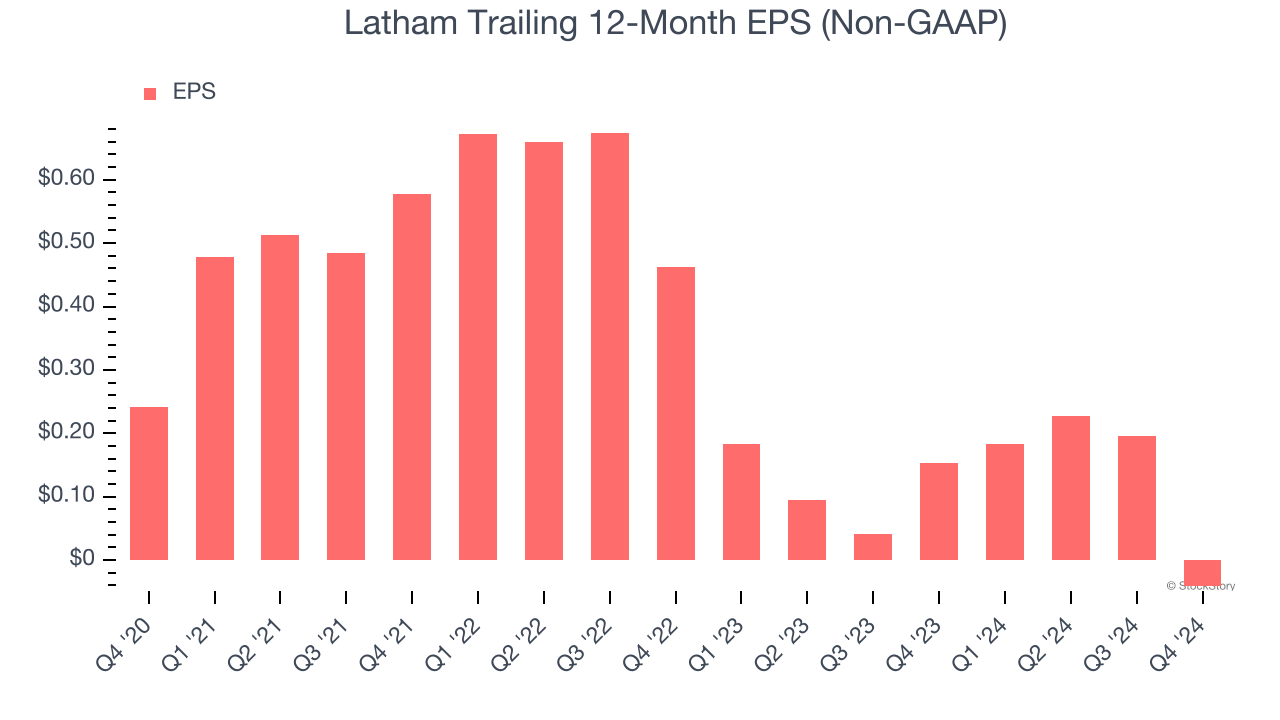
2. EPS Trending Down
Analyzing the long-term change in earnings per share (EPS) shows whether a company's incremental sales were profitable – for example, revenue could be inflated through excessive spending on advertising and promotions.
Sadly for Latham, its EPS declined by 21.4% annually over the last four years while its revenue grew by 6%. This tells us the company became less profitable on a per-share basis as it expanded.
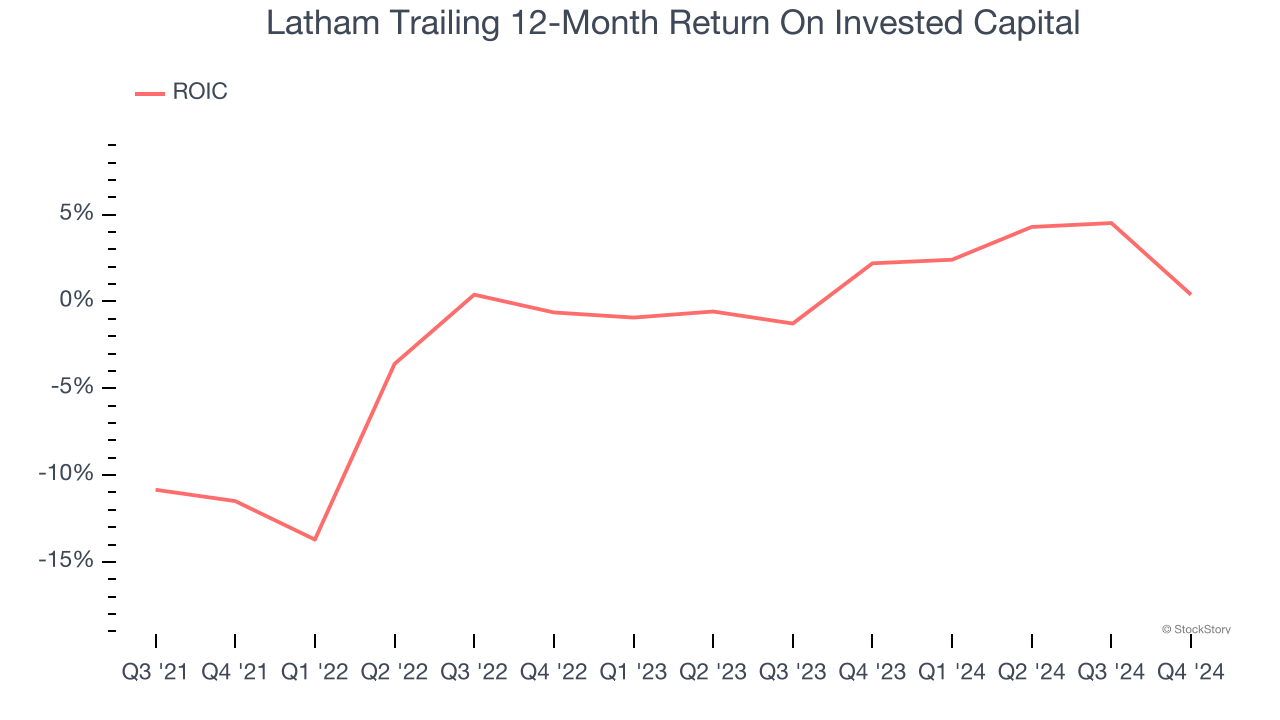
3. Previous Growth Initiatives Have Lost Money
Growth gives us insight into a company’s long-term potential, but how capital-efficient was that growth? Enter ROIC, a metric showing how much operating profit a company generates relative to the money it has raised (debt and equity).
Latham’s five-year average ROIC was negative 2.4%, meaning management lost money while trying to expand the business. Its returns were among the worst in the consumer discretionary sector.
Final Judgment
Latham isn’t a terrible business, but it doesn’t pass our quality test. Following the recent decline, the stock trades at 46.3× forward price-to-earnings (or $4.85 per share). This valuation tells us a lot of optimism is priced in - you can find better investment opportunities elsewhere. Let us point you toward our favorite semiconductor picks and shovels play.
Stocks We Like More Than Latham
Market indices reached historic highs following Donald Trump’s presidential victory in November 2024, but the outlook for 2025 is clouded by new trade policies that could impact business confidence and growth.
While this has caused many investors to adopt a "fearful" wait-and-see approach, we’re leaning into our best ideas that can grow regardless of the political or macroeconomic climate. Take advantage of Mr. Market by checking out our Top 6 Stocks for this week. This is a curated list of our High Quality stocks that have generated a market-beating return of 175% over the last five years.
Stocks that made our list in 2019 include now familiar names such as Nvidia (+2,183% between December 2019 and December 2024) as well as under-the-radar businesses like Sterling Infrastructure (+1,096% five-year return). Find your next big winner with StockStory today for free.


