
Even during a down period for the markets, Warner Bros. Discovery has gone against the grain, climbing to $8.03. Its shares have yielded a 6.8% return over the last six months, beating the S&P 500 by 16.6%. This performance may have investors wondering how to approach the situation.
Is there a buying opportunity in Warner Bros. Discovery, or does it present a risk to your portfolio? Get the full stock story straight from our expert analysts, it’s free.
Despite the momentum, we're cautious about Warner Bros. Discovery. Here are three reasons why there are better opportunities than WBD and a stock we'd rather own.
Why Do We Think Warner Bros. Discovery Will Underperform?
Formed from the merger of WarnerMedia and Discovery, Warner Bros. Discovery (NASDAQ: WBD) is a multinational media and entertainment company, offering television networks, streaming services, and film and television production.
1. Revenue Tumbling Downwards
Long-term growth is the most important, but within consumer discretionary, product cycles are short and revenue can be hit-driven due to rapidly changing trends and consumer preferences. Warner Bros. Discovery’s recent performance marks a sharp pivot from its five-year trend as its revenue has shown annualized declines of 4.5% over the last two years.
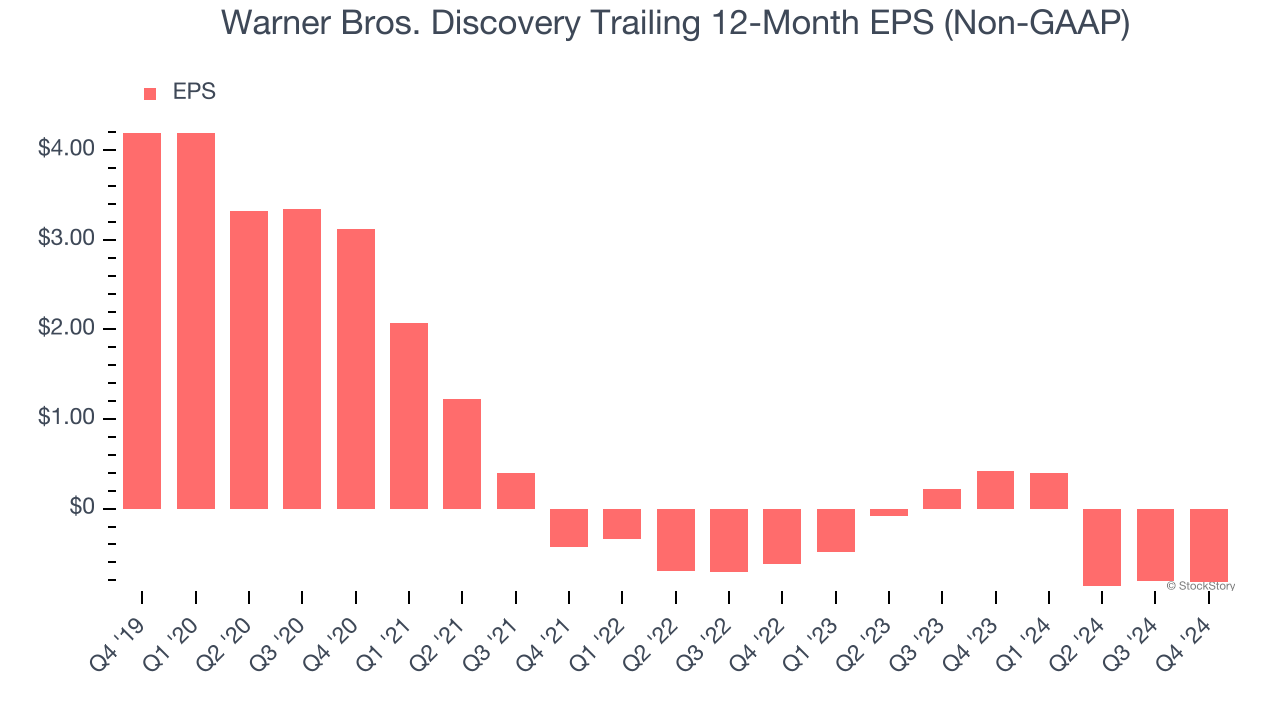
2. EPS Trending Down
Analyzing the long-term change in earnings per share (EPS) shows whether a company's incremental sales were profitable – for example, revenue could be inflated through excessive spending on advertising and promotions.
Sadly for Warner Bros. Discovery, its EPS declined by 17% annually over the last five years while its revenue grew by 28.7%. This tells us the company became less profitable on a per-share basis as it expanded.
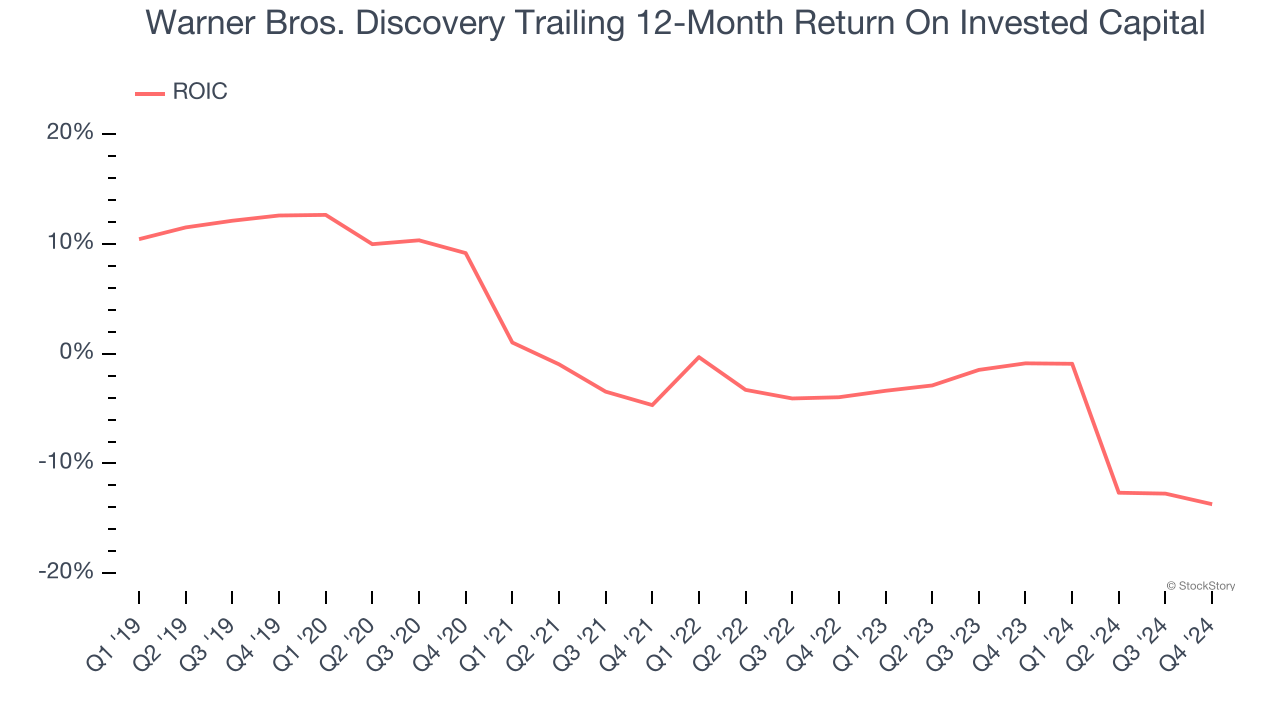
3. New Investments Fail to Bear Fruit as ROIC Declines
ROIC, or return on invested capital, is a metric showing how much operating profit a company generates relative to the money it has raised (debt and equity).
We like to invest in businesses with high returns, but the trend in a company’s ROIC is what often surprises the market and moves the stock price. Over the last few years, Warner Bros. Discovery’s ROIC has unfortunately decreased. Paired with its already low returns, these declines suggest its profitable growth opportunities are few and far between.
Final Judgment
Warner Bros. Discovery falls short of our quality standards. With its shares topping the market in recent months, the stock trades at 2.1× forward EV-to-EBITDA (or $8.03 per share). While this valuation is optically cheap, the potential downside is huge given its shaky fundamentals. There are better investments elsewhere. Let us point you toward a top digital advertising platform riding the creator economy.
Stocks We Like More Than Warner Bros. Discovery
Market indices reached historic highs following Donald Trump’s presidential victory in November 2024, but the outlook for 2025 is clouded by new trade policies that could impact business confidence and growth.
While this has caused many investors to adopt a "fearful" wait-and-see approach, we’re leaning into our best ideas that can grow regardless of the political or macroeconomic climate. Take advantage of Mr. Market by checking out our Top 5 Growth Stocks for this month. This is a curated list of our High Quality stocks that have generated a market-beating return of 175% over the last five years.
Stocks that made our list in 2019 include now familiar names such as Nvidia (+2,183% between December 2019 and December 2024) as well as under-the-radar businesses like Sterling Infrastructure (+1,096% five-year return). Find your next big winner with StockStory today for free.


