
Over the last six months, Hayward shares have sunk to $11.87, producing a disappointing 19.6% loss - worse than the S&P 500’s 9.8% drop. This may have investors wondering how to approach the situation.
Is now the time to buy Hayward, or should you be careful about including it in your portfolio? Get the full breakdown from our expert analysts, it’s free.
Despite the more favorable entry price, we don't have much confidence in Hayward. Here are three reasons why HAYW doesn't excite us and a stock we'd rather own.
Why Do We Think Hayward Will Underperform?
Credited with introducing the first variable-speed pool pump, Hayward (NYSE: HAYW) makes residential and commercial pool equipment and accessories.
1. Core Business Falling Behind as Demand Declines
Investors interested in Home Construction Materials companies should track organic revenue in addition to reported revenue. This metric gives visibility into Hayward’s core business because it excludes one-time events such as mergers, acquisitions, and divestitures along with foreign currency fluctuations - non-fundamental factors that can manipulate the income statement.
Over the last two years, Hayward’s organic revenue averaged 8% year-on-year declines. This performance was underwhelming and implies it may need to improve its products, pricing, or go-to-market strategy. It also suggests Hayward might have to lean into acquisitions to grow, which isn’t ideal because M&A can be expensive and risky (integrations often disrupt focus). 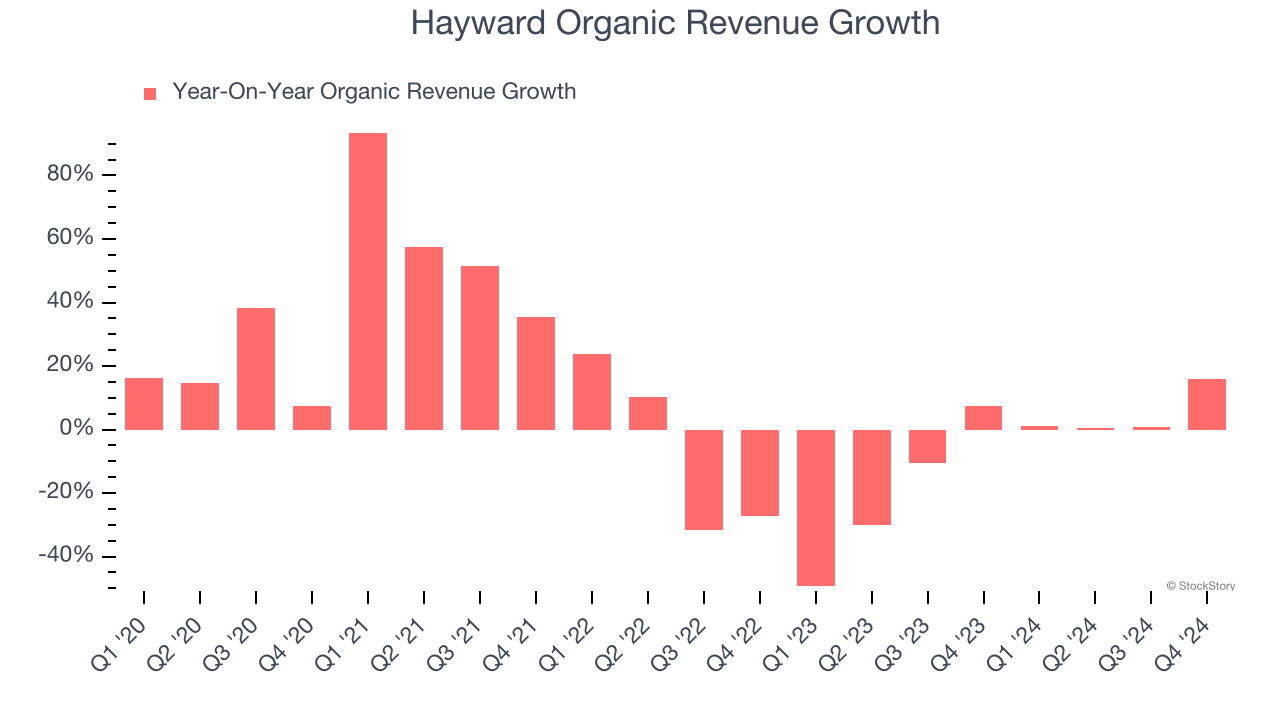
2. EPS Trending Down
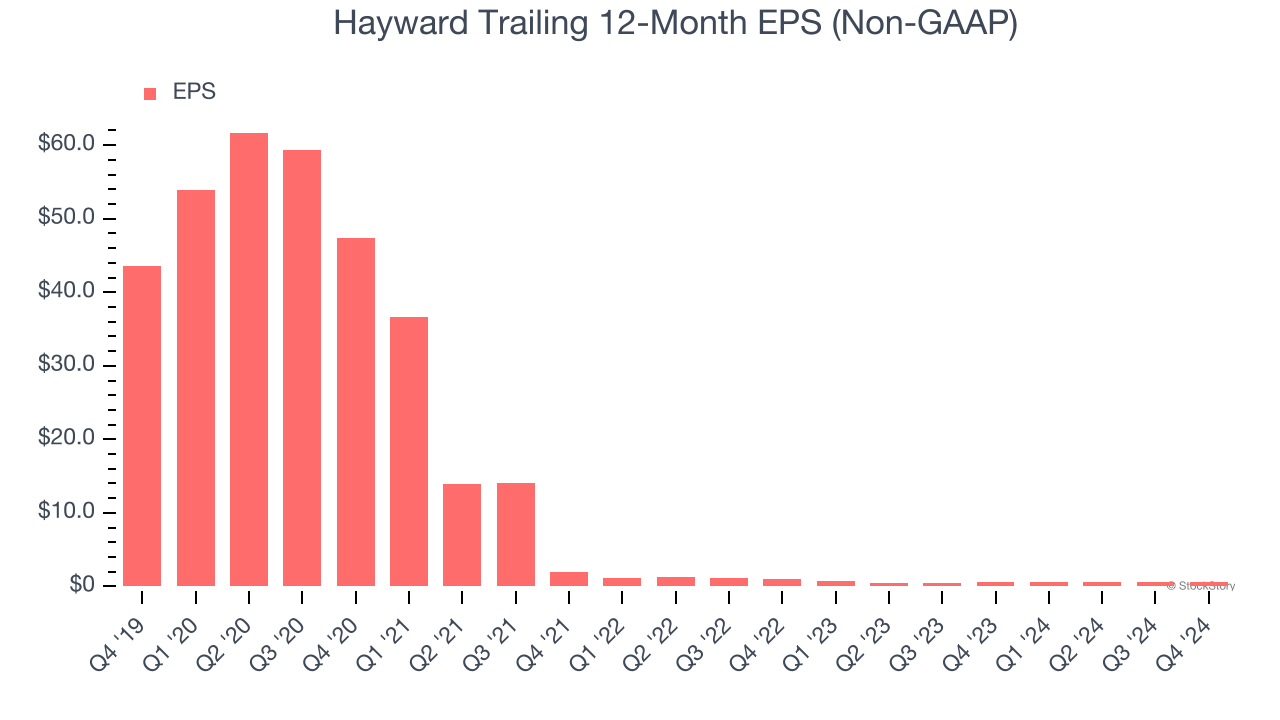
We track the long-term change in earnings per share (EPS) because it highlights whether a company’s growth is profitable.
Sadly for Hayward, its EPS declined by 56.6% annually over the last five years while its revenue grew by 7.5%. This tells us the company became less profitable on a per-share basis as it expanded.
3. Free Cash Flow Margin Dropping
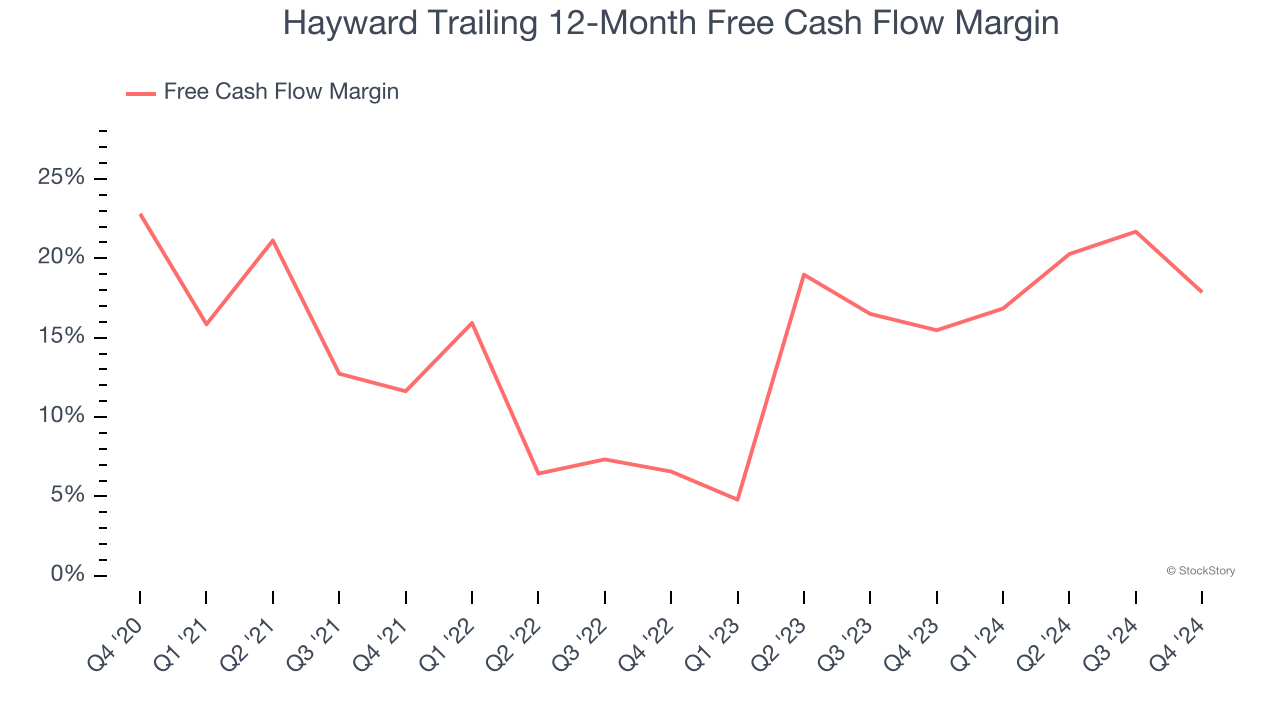
If you’ve followed StockStory for a while, you know we emphasize free cash flow. Why, you ask? We believe that in the end, cash is king, and you can’t use accounting profits to pay the bills.
As you can see below, Hayward’s margin dropped by 4.9 percentage points over the last five years. It may have ticked higher more recently, but shareholders are likely hoping for its margin to at least revert to its historical level. If the longer-term trend returns, it could signal increasing investment needs and capital intensity. Hayward’s free cash flow margin for the trailing 12 months was 17.9%.
Final Judgment
We see the value of companies helping their customers, but in the case of Hayward, we’re out. Following the recent decline, the stock trades at 16.3× forward price-to-earnings (or $11.87 per share). This multiple tells us a lot of good news is priced in - we think there are better stocks to buy right now. We’d recommend looking at the most entrenched endpoint security platform on the market.
Stocks We Like More Than Hayward
Donald Trump’s victory in the 2024 U.S. Presidential Election sent major indices to all-time highs, but stocks have retraced as investors debate the health of the economy and the potential impact of tariffs.
While this leaves much uncertainty around 2025, a few companies are poised for long-term gains regardless of the political or macroeconomic climate, like our Top 9 Market-Beating Stocks. This is a curated list of our High Quality stocks that have generated a market-beating return of 175% over the last five years.
Stocks that made our list in 2019 include now familiar names such as Nvidia (+2,183% between December 2019 and December 2024) as well as under-the-radar businesses like Comfort Systems (+751% five-year return). Find your next big winner with StockStory today for free.
