DraftKings trades at $35.19 per share and has moved almost in lockstep with the market over the last six months. The stock has lost 7.2% while the S&P 500 is down 7.3%. This may have investors wondering how to approach the situation.
Following the pullback, is this a buying opportunity for DKNG? Find out in our full research report, it’s free.
Why Does DKNG Stock Spark Debate?
Getting its start in daily fantasy sports, DraftKings (NASDAQ: DKNG) is a digital sports entertainment and gaming company.
Two Things to Like:
1. Growth in Monthly Unique Players Shows Increasing Demand
Revenue growth can be broken down into changes in price and volume (for companies like DraftKings, our preferred volume metric is monthly unique players). While both are important, the latter is the most critical to analyze because prices have a ceiling.
DraftKings’s monthly unique players punched in at 4.8 million in the latest quarter, and over the last two years, averaged 40.1% year-on-year growth. This performance was fantastic and shows its brand have a unique value proposition. 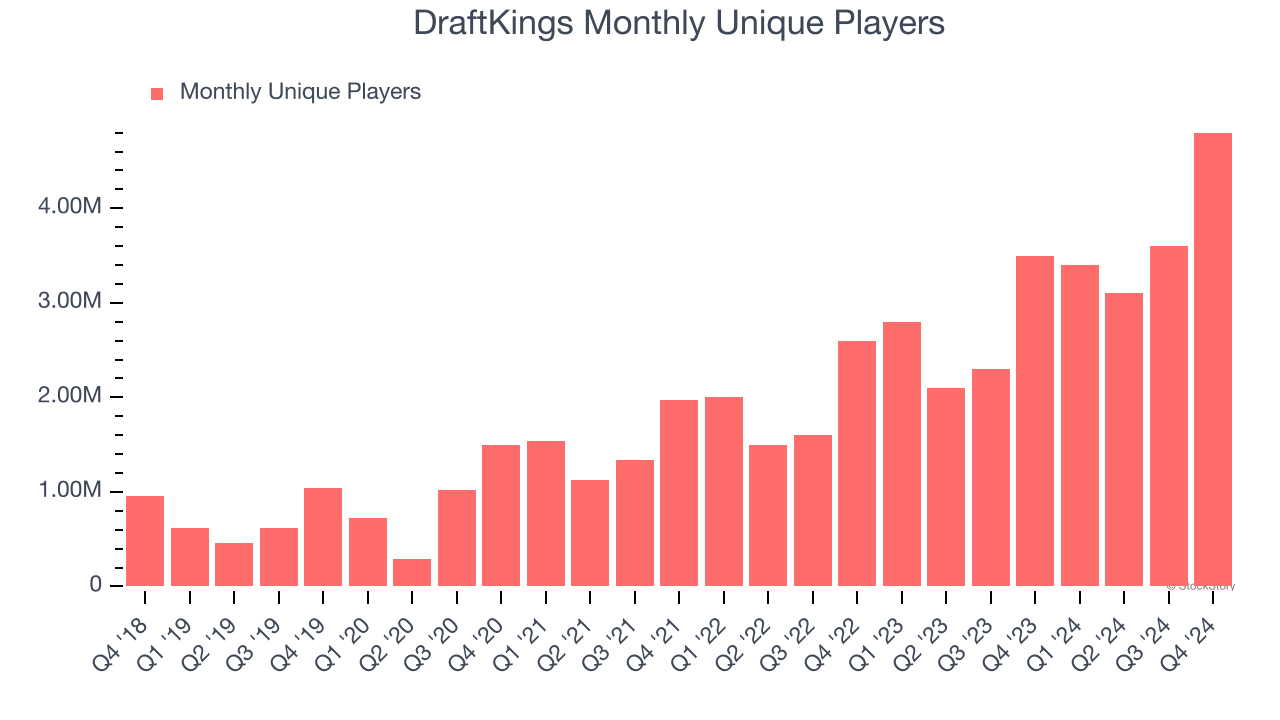
2. Projected Free Cash Flow Gains to Pump Profits
Free cash flow isn't a prominently featured metric in company financials and earnings releases, but we think it's telling because it accounts for all operating and capital expenses, making it tough to manipulate. Cash is king.
Over the next year, analysts predict DraftKings’s cash conversion will improve. Their consensus estimates imply its free cash flow margin of 8.5% for the last 12 months will increase to 12.9%, it options for capital deployment (investments, share buybacks, etc.).
One Reason to be Careful:
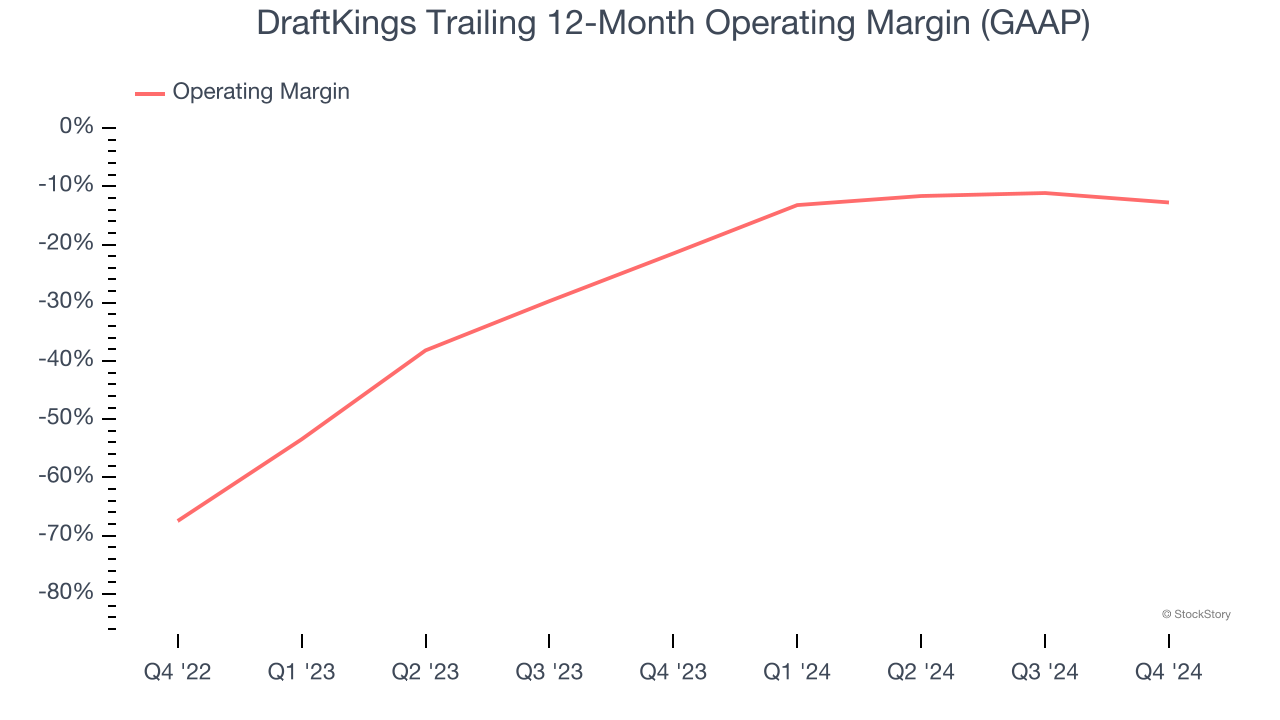
Operating Losses Sound the Alarms
Operating margin is a key measure of profitability. Think of it as net income - the bottom line - excluding the impact of taxes and interest on debt, which are less connected to business fundamentals.
DraftKings’s operating margin has risen over the last 12 months, but it still averaged negative 16.6% over the last two years. This is due to its large expense base and inefficient cost structure. It might have a shot at long-term profitability if it can scale quickly and gain operating leverage.
Final Judgment
DraftKings has huge potential even though it has some open questions. With the recent decline, the stock trades at 27.7× forward price-to-earnings (or $35.19 per share). Is now a good time to buy? See for yourself in our comprehensive research report, it’s free.
Stocks We Like Even More Than DraftKings
Market indices reached historic highs following Donald Trump’s presidential victory in November 2024, but the outlook for 2025 is clouded by new trade policies that could impact business confidence and growth.
While this has caused many investors to adopt a "fearful" wait-and-see approach, we’re leaning into our best ideas that can grow regardless of the political or macroeconomic climate. Take advantage of Mr. Market by checking out our Top 5 Strong Momentum Stocks for this week. This is a curated list of our High Quality stocks that have generated a market-beating return of 175% over the last five years.
Stocks that made our list in 2019 include now familiar names such as Nvidia (+2,183% between December 2019 and December 2024) as well as under-the-radar businesses like Comfort Systems (+751% five-year return). Find your next big winner with StockStory today for free.