The end of the earnings season is always a good time to take a step back and see who shined (and who not so much). Let’s take a look at how apparel and accessories stocks fared in Q4, starting with Oxford Industries (NYSE: OXM).
Thanks to social media and the internet, not only are styles changing more frequently today than in decades past but also consumers are shifting the way they buy their goods, favoring omnichannel and e-commerce experiences. Some apparel and accessories companies have made concerted efforts to adapt while those who are slower to move may fall behind.
The 16 apparel and accessories stocks we track reported a strong Q4. As a group, revenues beat analysts’ consensus estimates by 2.5% while next quarter’s revenue guidance was in line.
Amidst this news, share prices of the companies have had a rough stretch. On average, they are down 15% since the latest earnings results.
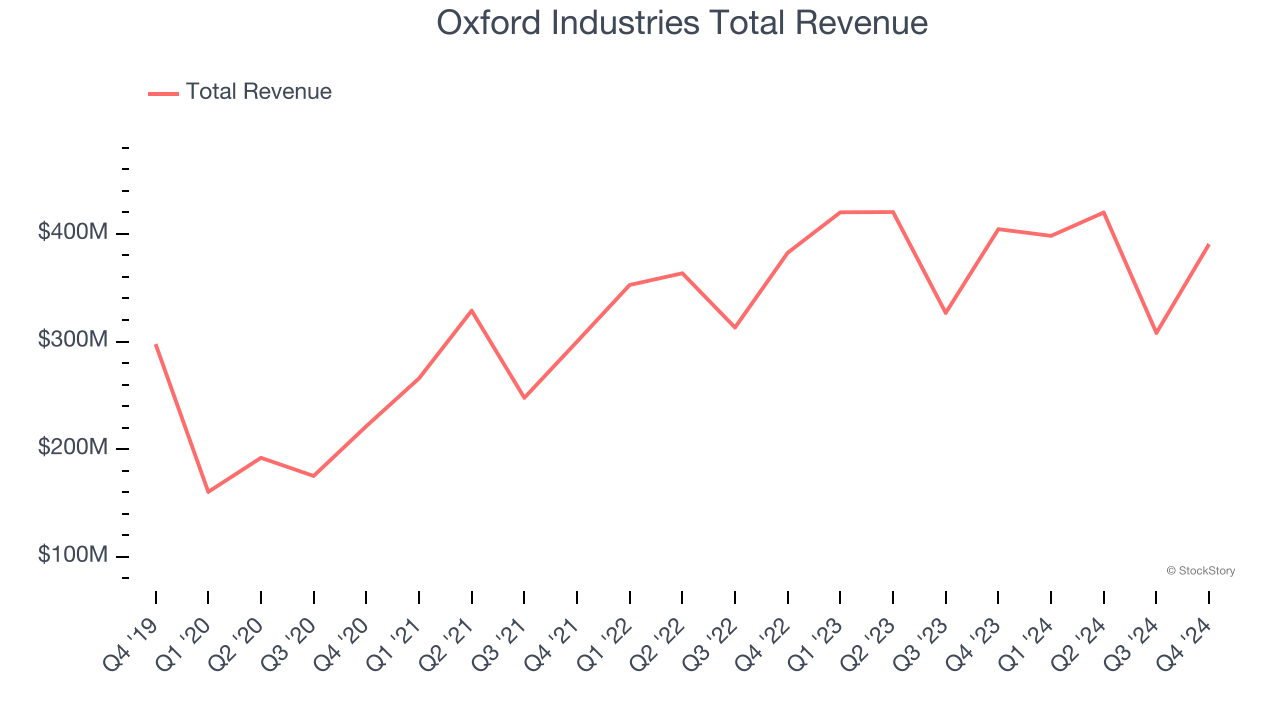
Oxford Industries (NYSE: OXM)
The parent company of Tommy Bahama, Oxford Industries (NYSE: OXM) is a lifestyle fashion conglomerate with brands that embody outdoor happiness.
Oxford Industries reported revenues of $390.5 million, down 3.4% year on year. This print exceeded analysts’ expectations by 1.7%. Despite the top-line beat, it was still a slower quarter for the company with full-year EPS guidance missing analysts’ expectations.
Tom Chubb, Chairman and CEO, commented, “We are pleased to report fourth quarter net sales and adjusted earnings per share that were near the top end of our guidance ranges. Our results were driven by a successful holiday season as our consumer showed up to buy their loved ones and friends the gifts that they really wanted from the brands that they love. Following a strong finish to calendar year 2024, trends moderated in January as there was less of a reason to shop, a pattern we’ve witnessed for the past several quarters, as well as a deterioration in consumer sentiment that also weighed on demand.”
The stock is down 17.2% since reporting and currently trades at $51.89.
Read our full report on Oxford Industries here, it’s free.
Best Q4: VF Corp (NYSE: VFC)
Owner of The North Face, Vans, and Supreme, VF Corp (NYSE: VFC) is a clothing conglomerate specializing in branded lifestyle apparel, footwear, and accessories.
VF Corp reported revenues of $2.83 billion, up 1.9% year on year, outperforming analysts’ expectations by 1.2%. The business had a stunning quarter with an impressive beat of analysts’ constant currency revenue and EPS estimates.
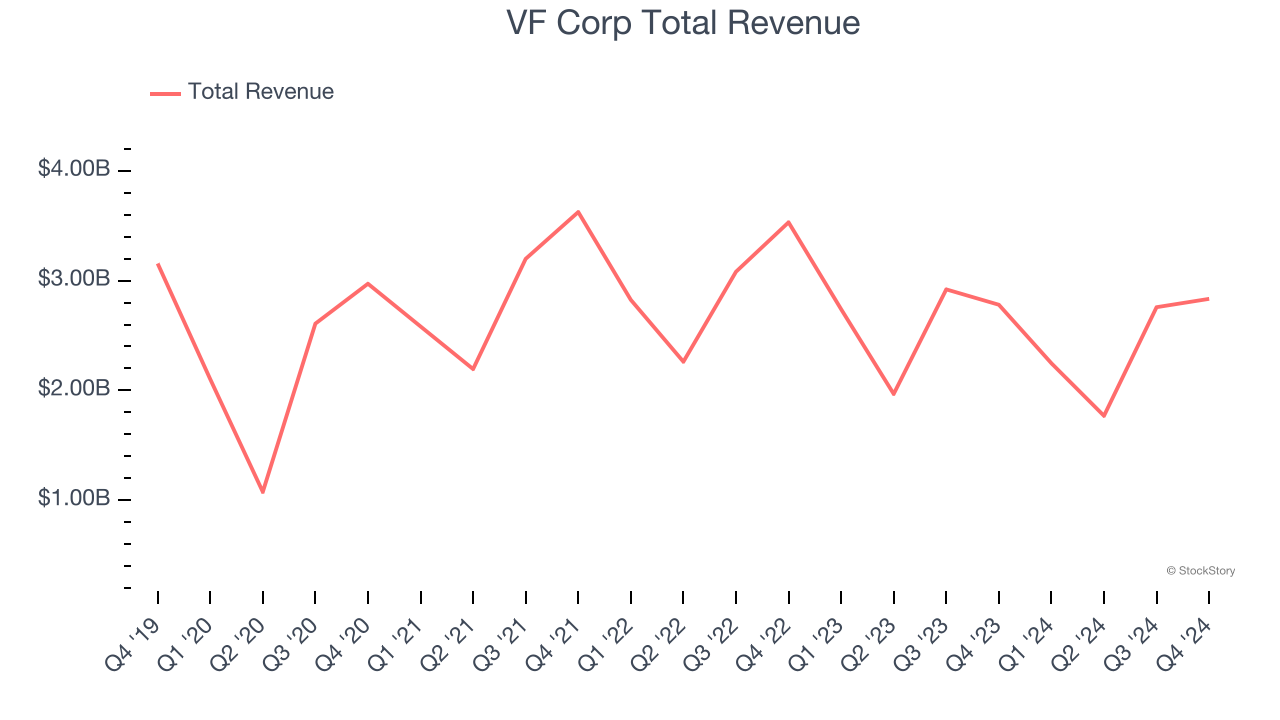
The stock is down 57.7% since reporting. It currently trades at $11.25.
Is now the time to buy VF Corp? Access our full analysis of the earnings results here, it’s free.
Weakest Q4: Columbia Sportswear (NASDAQ: COLM)
Originally founded as a hat store in 1938, Columbia Sportswear (NASDAQ: COLM) is a manufacturer of outerwear, sportswear, and footwear designed for outdoor enthusiasts.
Columbia Sportswear reported revenues of $1.10 billion, up 3.5% year on year, exceeding analysts’ expectations by 1.4%. Still, it was a slower quarter as it posted full-year EPS guidance missing analysts’ expectations.
As expected, the stock is down 22.6% since the results and currently trades at $66.49.
Read our full analysis of Columbia Sportswear’s results here.
Guess (NYSE: GES)
Flexing the iconic upside-down triangle logo with a question mark, Guess (NYSE: GES) is a global fashion brand known for its trendy clothing, accessories, and denim wear.
Guess reported revenues of $932.3 million, up 4.6% year on year. This number beat analysts’ expectations by 2.9%. However, it was a slower quarter as it recorded full-year EPS guidance missing analysts’ expectations.
The stock is up 1.6% since reporting and currently trades at $10.25.
Read our full, actionable report on Guess here, it’s free.
Carter's (NYSE: CRI)
Rumored to sell more than 10 products for every child born in the United States, Carter's (NYSE: CRI) is an American designer and marketer of children's apparel.
Carter's reported revenues of $859.7 million, flat year on year. This print surpassed analysts’ expectations by 3%. More broadly, it was a mixed quarter as it also recorded an impressive beat of analysts’ same-store sales estimates but full-year EPS guidance missing analysts’ expectations significantly.
The stock is down 29.9% since reporting and currently trades at $36.50.
Read our full, actionable report on Carter's here, it’s free.
Market Update
Thanks to the Fed’s series of rate hikes in 2022 and 2023, inflation has cooled significantly from its post-pandemic highs, drawing closer to the 2% goal. This disinflation has occurred without severely impacting economic growth, suggesting the success of a soft landing. The stock market thrived in 2024, spurred by recent rate cuts (0.5% in September and 0.25% in November), and a notable surge followed Donald Trump’s presidential election win in November, propelling indices to historic highs. Nonetheless, the outlook for 2025 remains clouded by potential trade policy changes and corporate tax discussions, which could impact business confidence and growth. The path forward holds both optimism and caution as new policies take shape.
Want to invest in winners with rock-solid fundamentals? Check out our 9 Best Market-Beating Stocks and add them to your watchlist. These companies are poised for growth regardless of the political or macroeconomic climate.
Join Paid Stock Investor Research
Help us make StockStory more helpful to investors like yourself. Join our paid user research session and receive a $50 Amazon gift card for your opinions. Sign up here.