What a brutal six months it’s been for Nordson. The stock has dropped 27.9% and now trades at $185.50, rattling many shareholders. This was partly driven by its softer quarterly results and might have investors contemplating their next move.
Is there a buying opportunity in Nordson, or does it present a risk to your portfolio? See what our analysts have to say in our full research report, it’s free.
Even though the stock has become cheaper, we're swiping left on Nordson for now. Here are three reasons why you should be careful with NDSN and a stock we'd rather own.
Why Is Nordson Not Exciting?
Founded in 1954, Nordson Corporation (NASDAQ: NDSN) manufactures dispensing equipment and industrial adhesives, sealants and coatings.
1. Core Business Falling Behind as Demand Declines
In addition to reported revenue, organic revenue is a useful data point for analyzing Professional Tools and Equipment companies. This metric gives visibility into Nordson’s core business because it excludes one-time events such as mergers, acquisitions, and divestitures along with foreign currency fluctuations - non-fundamental factors that can manipulate the income statement.
Over the last two years, Nordson’s organic revenue averaged 3.2% year-on-year declines. This performance was underwhelming and implies it may need to improve its products, pricing, or go-to-market strategy. It also suggests Nordson might have to lean into acquisitions to grow, which isn’t ideal because M&A can be expensive and risky (integrations often disrupt focus). 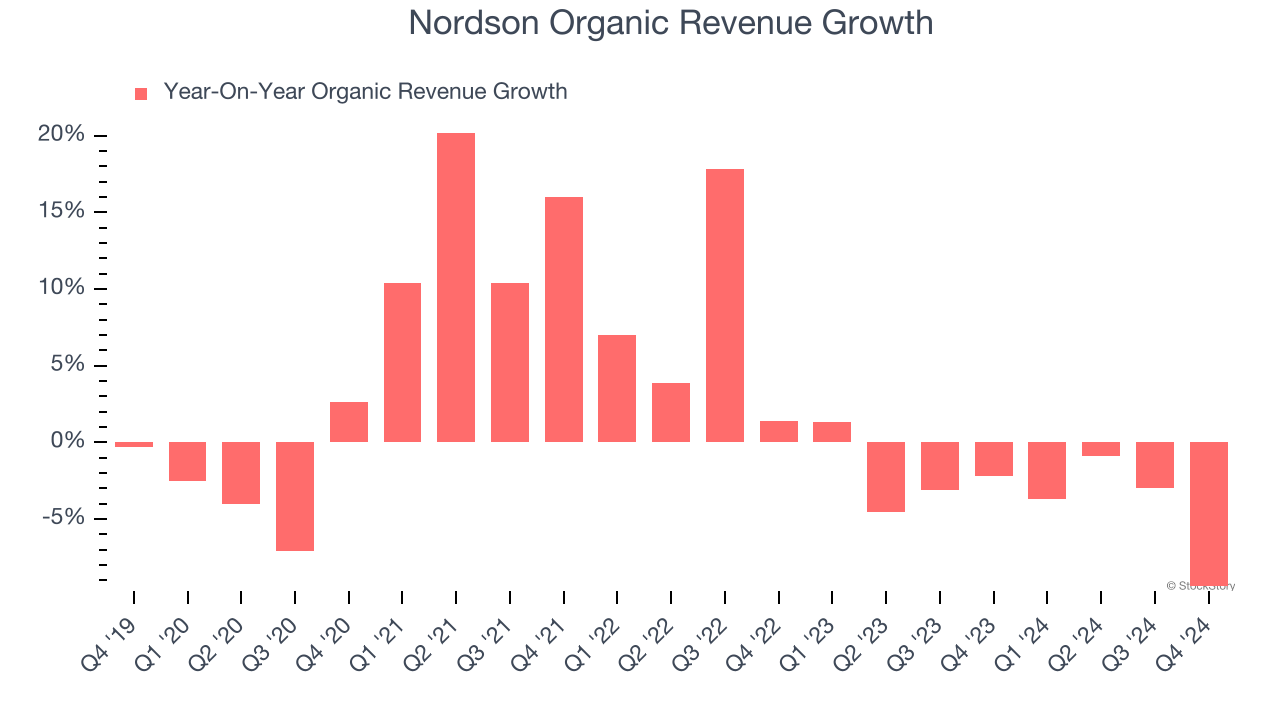
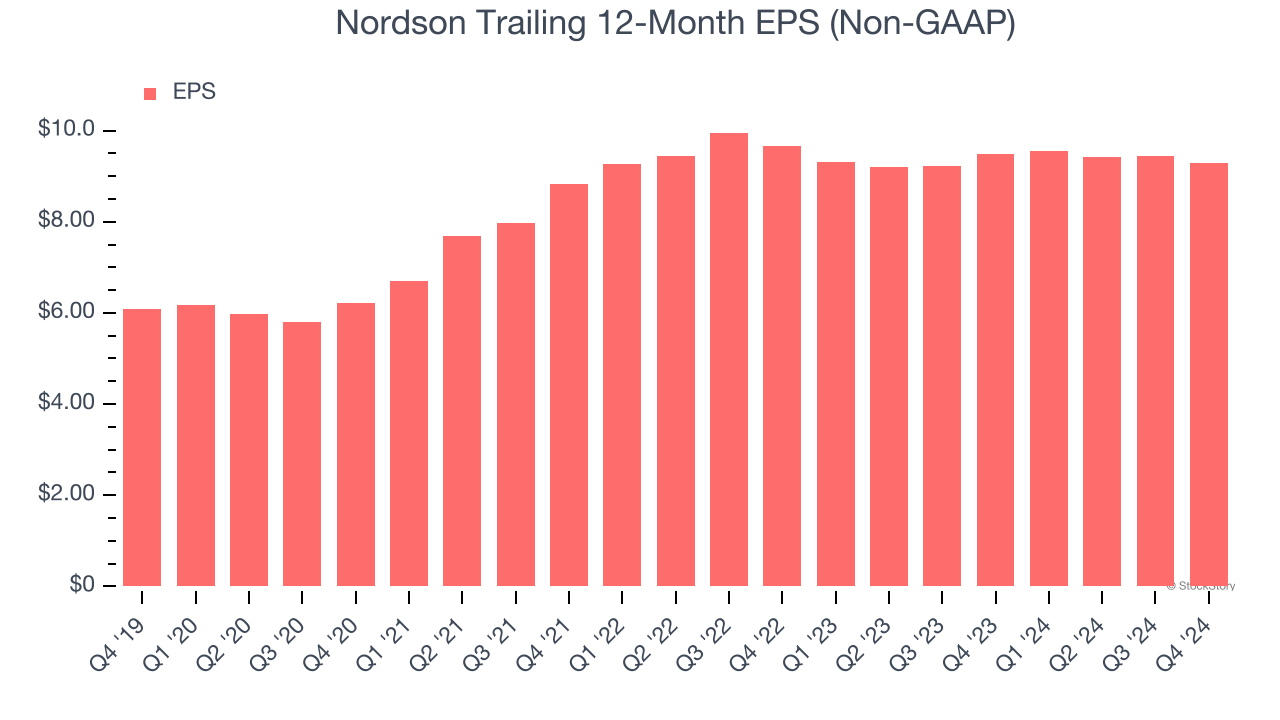
2. EPS Took a Dip Over the Last Two Years
Although long-term earnings trends give us the big picture, we like to analyze EPS over a shorter period to see if we are missing a change in the business.
Sadly for Nordson, its EPS declined by 1.9% annually over the last two years while its revenue grew by 1.5%. This tells us the company became less profitable on a per-share basis as it expanded.
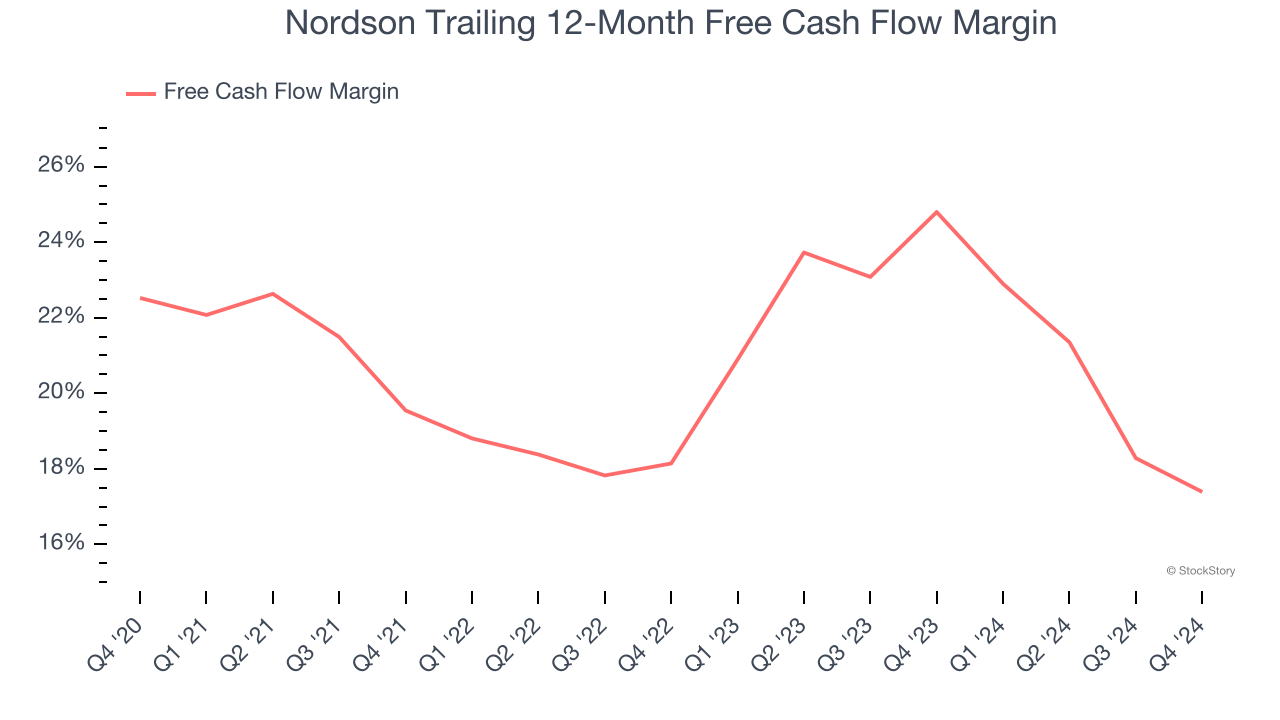
3. Free Cash Flow Margin Dropping
If you’ve followed StockStory for a while, you know we emphasize free cash flow. Why, you ask? We believe that in the end, cash is king, and you can’t use accounting profits to pay the bills.
As you can see below, Nordson’s margin dropped by 5.1 percentage points over the last five years. If its declines continue, it could signal increasing investment needs and capital intensity. Nordson’s free cash flow margin for the trailing 12 months was 17.4%.
Final Judgment
Nordson isn’t a terrible business, but it doesn’t pass our quality test. Following the recent decline, the stock trades at 18× forward price-to-earnings (or $185.50 per share). At this valuation, there’s a lot of good news priced in - you can find better investment opportunities elsewhere. We’d suggest looking at an all-weather company that owns household favorite Taco Bell.
Stocks We Would Buy Instead of Nordson
Donald Trump’s victory in the 2024 U.S. Presidential Election sent major indices to all-time highs, but stocks have retraced as investors debate the health of the economy and the potential impact of tariffs.
While this leaves much uncertainty around 2025, a few companies are poised for long-term gains regardless of the political or macroeconomic climate, like our Top 6 Stocks for this week. This is a curated list of our High Quality stocks that have generated a market-beating return of 175% over the last five years.
Stocks that made our list in 2019 include now familiar names such as Nvidia (+2,183% between December 2019 and December 2024) as well as under-the-radar businesses like Comfort Systems (+751% five-year return). Find your next big winner with StockStory today for free.