Nu Skin has been treading water for the past six months, recording a small return of 1.6% while holding steady at $6.98.
Is there a buying opportunity in Nu Skin, or does it present a risk to your portfolio? Get the full stock story straight from our expert analysts, it’s free.
We're swiping left on Nu Skin for now. Here are three reasons why there are better opportunities than NUS and a stock we'd rather own.
Why Is Nu Skin Not Exciting?
With person-to-person marketing and sales rather than selling through retail stores, Nu Skin (NYSE: NUS) is a personal care and dietary supplements company that engages in direct selling.
1. Revenue Spiraling Downwards
Examining a company’s long-term performance can provide clues about its quality. Even a bad business can shine for one or two quarters, but a top-tier one grows for years. Nu Skin struggled to consistently generate demand over the last three years as its sales dropped at a 13.7% annual rate. This wasn’t a great result and is a sign of lacking business quality. 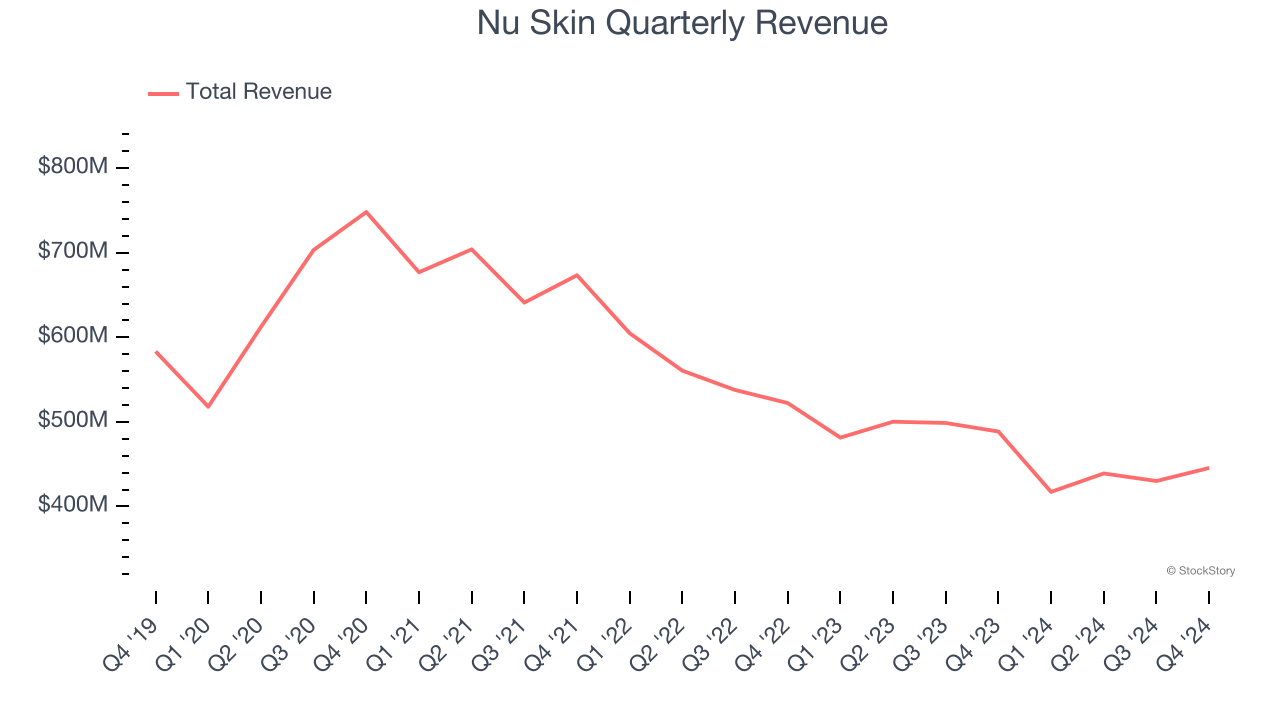
2. Shrinking Operating Margin
Operating margin is an important measure of profitability as it shows the portion of revenue left after accounting for all core expenses – everything from the cost of goods sold to advertising and wages. It’s also useful for comparing profitability across companies with different levels of debt and tax rates because it excludes interest and taxes.
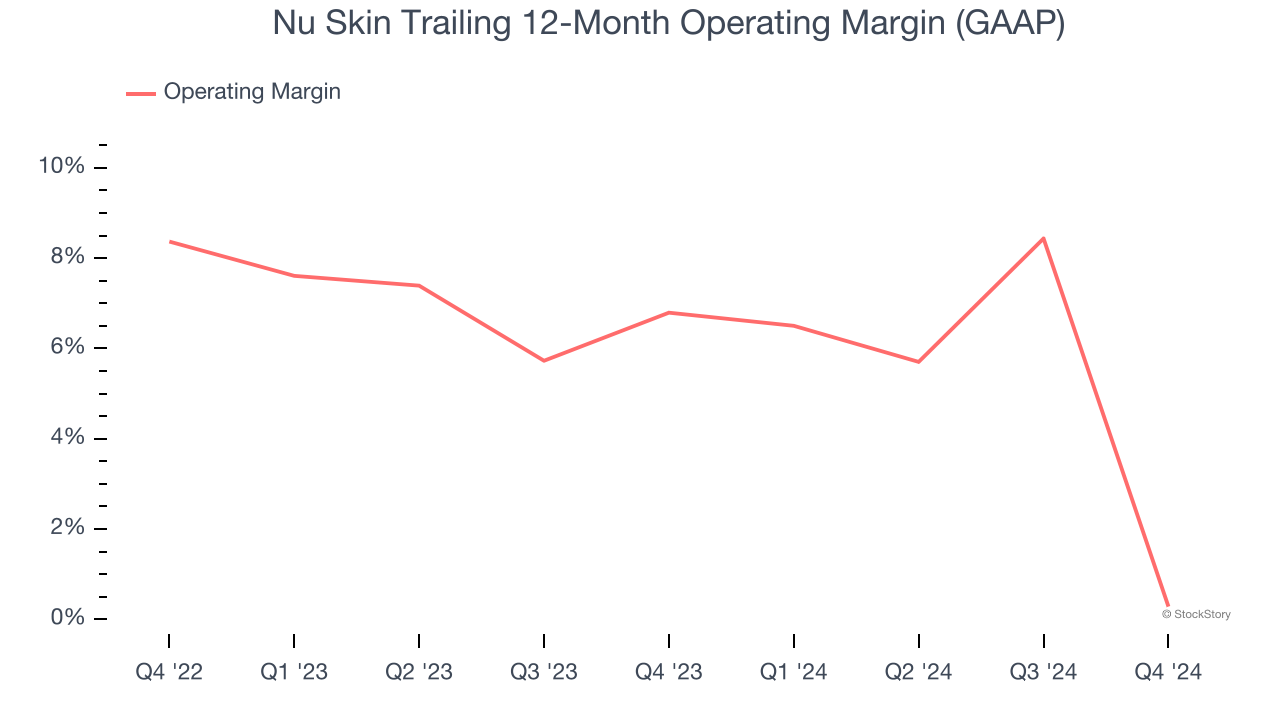
Looking at the trend in its profitability, Nu Skin’s operating margin decreased by 6.5 percentage points over the last year. Nu Skin’s performance was poor no matter how you look at it - it shows that costs were rising and it couldn’t pass them onto its customers. Its operating margin for the trailing 12 months was breakeven.
3. EPS Trending Down
Analyzing the change in earnings per share (EPS) shows whether a company's incremental sales were profitable – for example, revenue could be inflated through excessive spending on advertising and promotions.
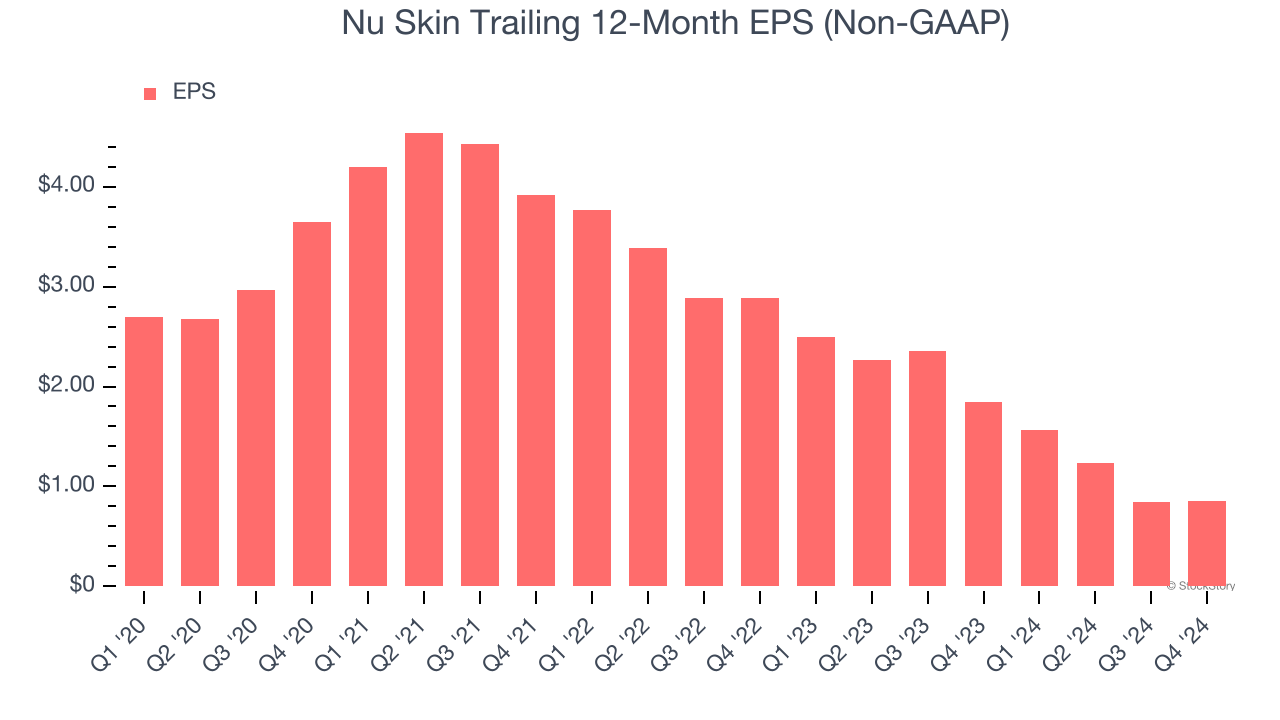
Sadly for Nu Skin, its EPS declined by 39.9% annually over the last three years, more than its revenue. This tells us the company struggled because its fixed cost base made it difficult to adjust to shrinking demand.
Final Judgment
Nu Skin isn’t a terrible business, but it doesn’t pass our quality test. That said, the stock currently trades at 6.8× forward price-to-earnings (or $6.98 per share). While this valuation is optically cheap, the potential downside is big given its shaky fundamentals. We're fairly confident there are better investments elsewhere. We’d suggest looking at a fast-growing restaurant franchise with an A+ ranch dressing sauce.
Stocks We Would Buy Instead of Nu Skin
Market indices reached historic highs following Donald Trump’s presidential victory in November 2024, but the outlook for 2025 is clouded by new trade policies that could impact business confidence and growth.
While this has caused many investors to adopt a "fearful" wait-and-see approach, we’re leaning into our best ideas that can grow regardless of the political or macroeconomic climate. Take advantage of Mr. Market by checking out our Top 9 Market-Beating Stocks. This is a curated list of our High Quality stocks that have generated a market-beating return of 175% over the last five years.
Stocks that made our list in 2019 include now familiar names such as Nvidia (+2,183% between December 2019 and December 2024) as well as under-the-radar businesses like Sterling Infrastructure (+1,096% five-year return). Find your next big winner with StockStory today for free.