
While the broader market has struggled with the S&P 500 down 1.7% since October 2024, Lindblad Expeditions has surged ahead as its stock price has climbed by 14.6% to $10.28 per share. This performance may have investors wondering how to approach the situation.
Is there a buying opportunity in Lindblad Expeditions, or does it present a risk to your portfolio? Dive into our full research report to see our analyst team’s opinion, it’s free.
We’re happy investors have made money, but we're swiping left on Lindblad Expeditions for now. Here are three reasons why there are better opportunities than LIND and a stock we'd rather own.
Why Do We Think Lindblad Expeditions Will Underperform?
Founded by explorer Sven-Olof Lindblad in 1979, Lindblad Expeditions (NASDAQ: LIND) offers cruising experiences to remote destinations in partnership with National Geographic.
1. Long-Term Revenue Growth Disappoints
A company’s long-term sales performance is one signal of its overall quality. Even a bad business can shine for one or two quarters, but a top-tier one grows for years. Over the last five years, Lindblad Expeditions grew its sales at a 13.4% annual rate. Although this growth is acceptable on an absolute basis, it fell short of our standards for the consumer discretionary sector, which enjoys a number of secular tailwinds. 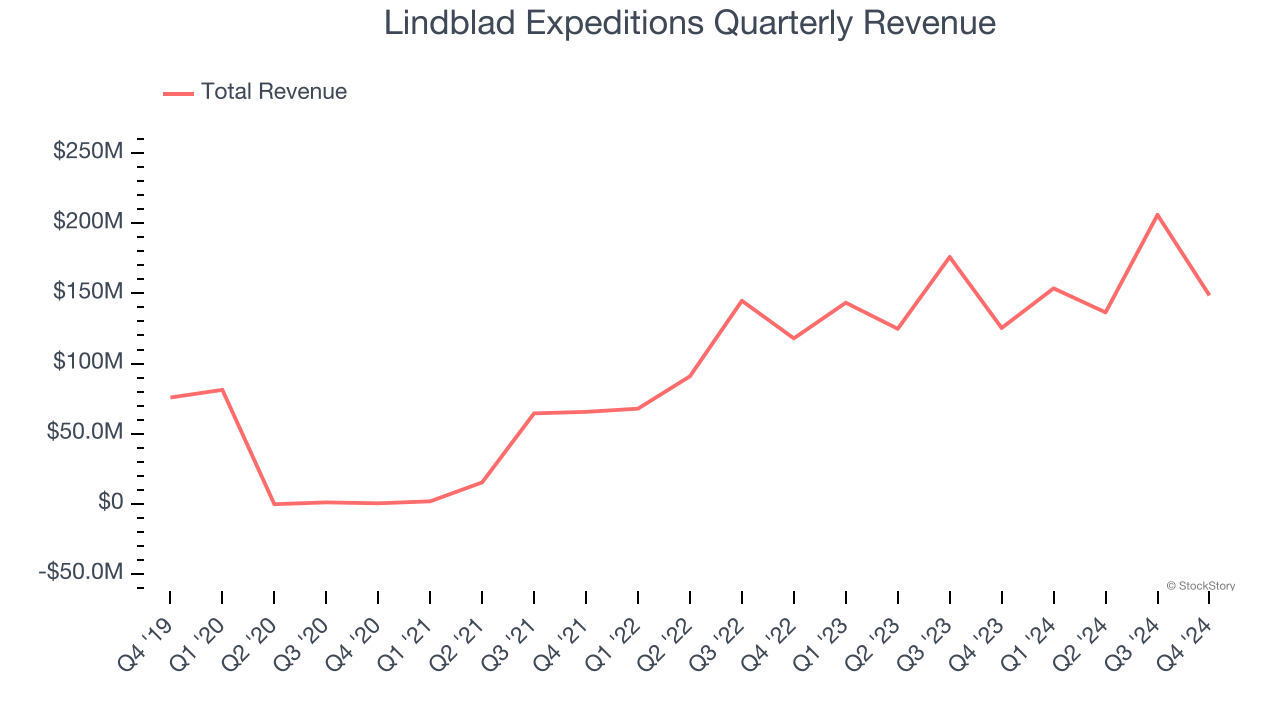
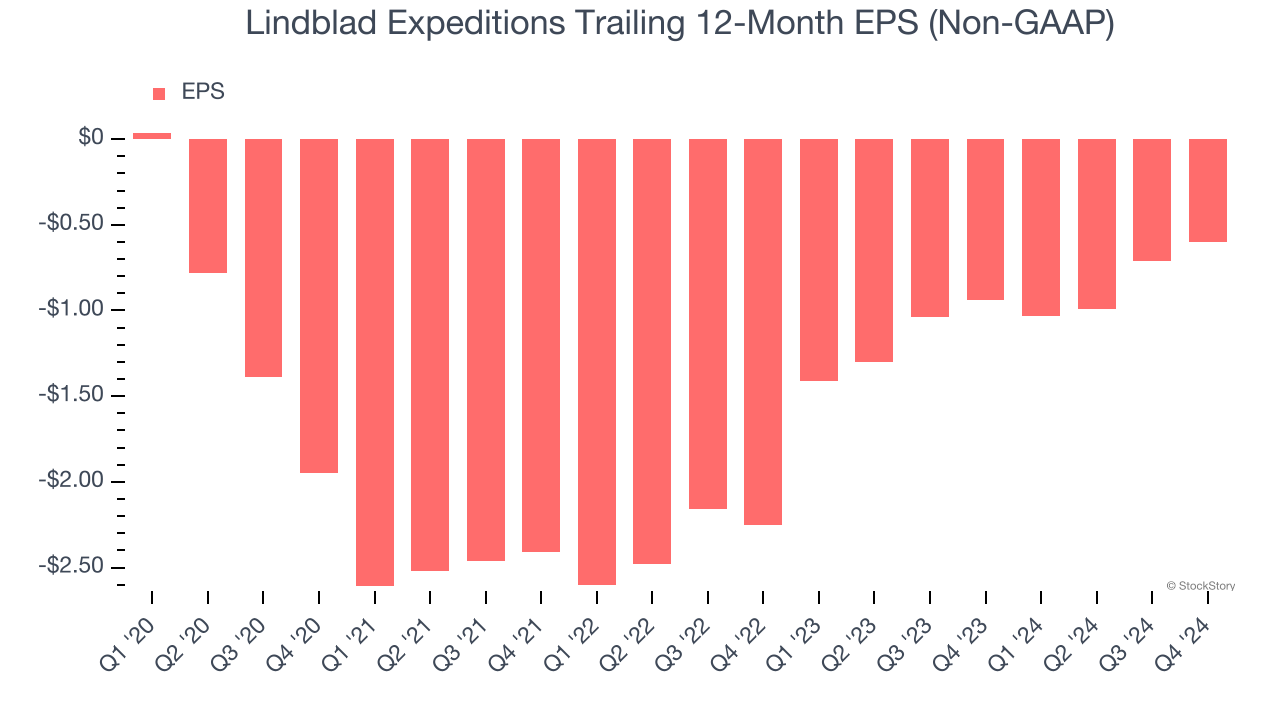
2. EPS Trending Down
Analyzing the long-term change in earnings per share (EPS) shows whether a company's incremental sales were profitable – for example, revenue could be inflated through excessive spending on advertising and promotions.
Sadly for Lindblad Expeditions, its EPS declined by 73% annually over the last five years while its revenue grew by 13.4%. This tells us the company became less profitable on a per-share basis as it expanded.
3. Cash Flow Margin Set to Decline
If you’ve followed StockStory for a while, you know we emphasize free cash flow. Why, you ask? We believe that in the end, cash is king, and you can’t use accounting profits to pay the bills.
Over the next year, analysts predict Lindblad Expeditions’s cash conversion will fall. Their consensus estimates imply its free cash flow margin of 9.1% for the last 12 months will decrease to 5.1%.
Final Judgment
Lindblad Expeditions doesn’t pass our quality test. With its shares outperforming the market lately, the stock trades at 4.7× forward EV-to-EBITDA (or $10.28 per share). While this valuation is optically cheap, the potential downside is huge given its shaky fundamentals. There are superior stocks to buy right now. We’d recommend looking at the Amazon and PayPal of Latin America.
Stocks We Would Buy Instead of Lindblad Expeditions
The market surged in 2024 and reached record highs after Donald Trump’s presidential victory in November, but questions about new economic policies are adding much uncertainty for 2025.
While the crowd speculates what might happen next, we’re homing in on the companies that can succeed regardless of the political or macroeconomic environment. Put yourself in the driver’s seat and build a durable portfolio by checking out our Top 9 Market-Beating Stocks. This is a curated list of our High Quality stocks that have generated a market-beating return of 175% over the last five years.
Stocks that made our list in 2019 include now familiar names such as Nvidia (+2,183% between December 2019 and December 2024) as well as under-the-radar businesses like Sterling Infrastructure (+1,096% five-year return). Find your next big winner with StockStory today for free.