Clinical research company Medpace Holdings (NASDAQ: MEDP) announced better-than-expected revenue in Q1 CY2025, with sales up 9.3% year on year to $558.6 million. The company’s full-year revenue guidance of $2.19 billion at the midpoint came in 1.9% above analysts’ estimates. Its GAAP profit of $3.67 per share was 20.8% above analysts’ consensus estimates.
Is now the time to buy Medpace? Find out by accessing our full research report, it’s free.
Medpace (MEDP) Q1 CY2025 Highlights:
- Revenue: $558.6 million vs analyst estimates of $527.1 million (9.3% year-on-year growth, 6% beat)
- EPS (GAAP): $3.67 vs analyst estimates of $3.04 (20.8% beat)
- Adjusted EBITDA: $118.6 million vs analyst estimates of $118.1 million (21.2% margin, in line)
- The company lifted its revenue guidance for the full year to $2.19 billion at the midpoint from $2.16 billion, a 1.4% increase
- EPS (GAAP) guidance for the full year is $12.65 at the midpoint, beating analyst estimates by 2.8%
- EBITDA guidance for the full year is $477 million at the midpoint, in line with analyst expectations
- Operating Margin: 20.3%, in line with the same quarter last year
- Free Cash Flow Margin: 20.7%, down from 28.8% in the same quarter last year
- Organic Revenue rose 9.3% year on year (17.6% in the same quarter last year)
- Market Capitalization: $8.96 billion
Company Overview
Founded in 1992 as a scientifically-driven alternative to traditional contract research organizations, Medpace (NASDAQ: MEDP) provides outsourced clinical trial management and research services to help pharmaceutical, biotechnology, and medical device companies develop new treatments.
Drug Development Inputs & Services
Companies specializing in drug development inputs and services play a crucial role in the pharmaceutical and biotechnology value chain. Essential support for drug discovery, preclinical testing, and manufacturing means stable demand, as pharmaceutical companies often outsource non-core functions with medium to long-term contracts. However, the business model faces high capital requirements, customer concentration, and vulnerability to shifts in biopharma R&D budgets or regulatory frameworks. Looking ahead, the industry will likely enjoy tailwinds such as increasing investment in biologics, cell and gene therapies, and advancements in precision medicine, which drive demand for sophisticated tools and services. There is a growing trend of outsourcing in drug development for nimbleness and cost efficiency, which benefits the industry. On the flip side, potential headwinds include pricing pressures as efforts to contain healthcare costs are always top of mind. An evolving regulatory backdrop could also slow innovation or client activity.
Sales Growth
A company’s long-term performance is an indicator of its overall quality. Any business can experience short-term success, but top-performing ones enjoy sustained growth for years. Thankfully, Medpace’s 19.3% annualized revenue growth over the last five years was impressive. Its growth beat the average healthcare company and shows its offerings resonate with customers, a helpful starting point for our analysis.
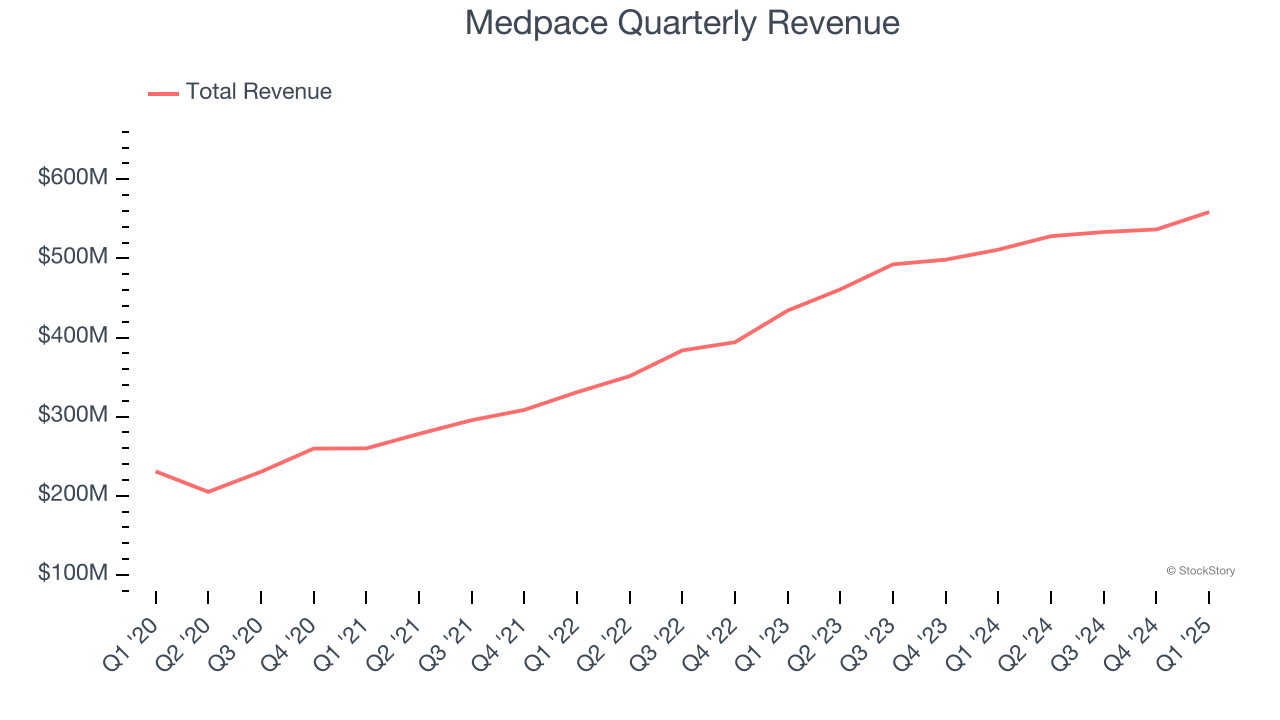
We at StockStory place the most emphasis on long-term growth, but within healthcare, a half-decade historical view may miss recent innovations or disruptive industry trends. Medpace’s annualized revenue growth of 17.5% over the last two years is below its five-year trend, but we still think the results suggest healthy demand. 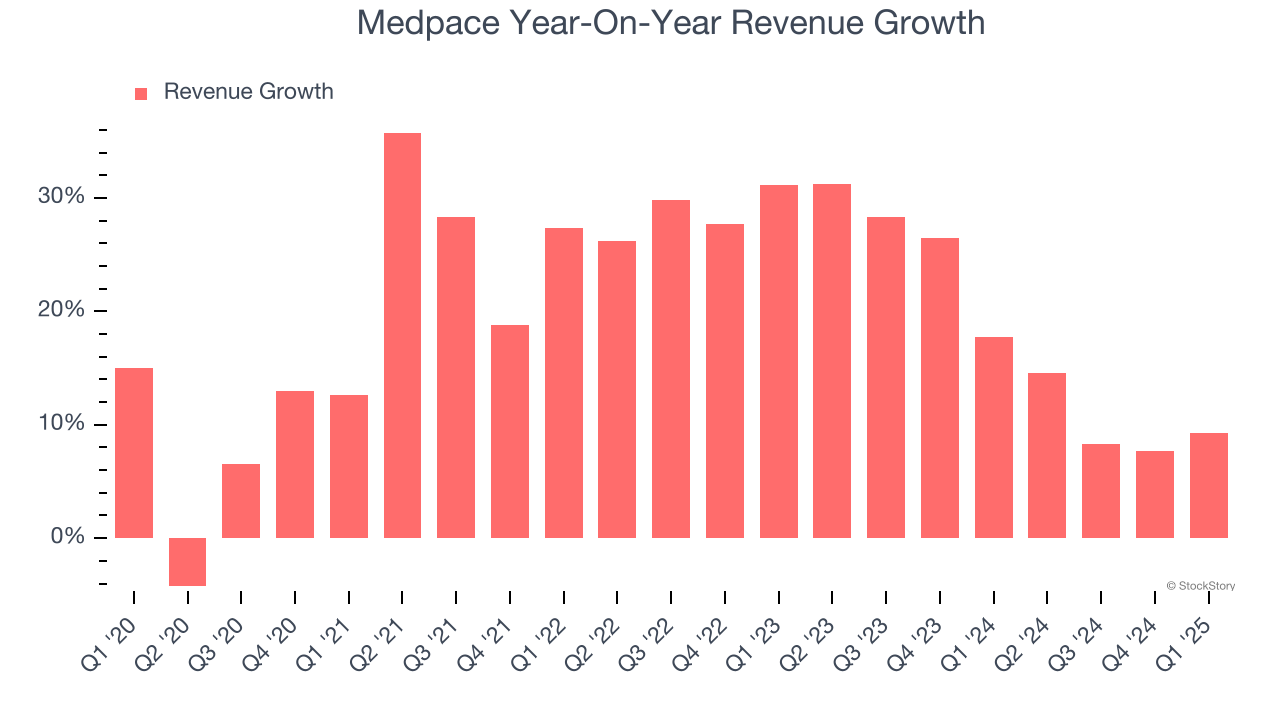
We can better understand the company’s sales dynamics by analyzing its organic revenue, which strips out one-time events like acquisitions and currency fluctuations that don’t accurately reflect its fundamentals. Over the last two years, Medpace’s organic revenue averaged 17.8% year-on-year growth. Because this number aligns with its normal revenue growth, we can see the company’s core operations (not acquisitions and divestitures) drove most of its results. 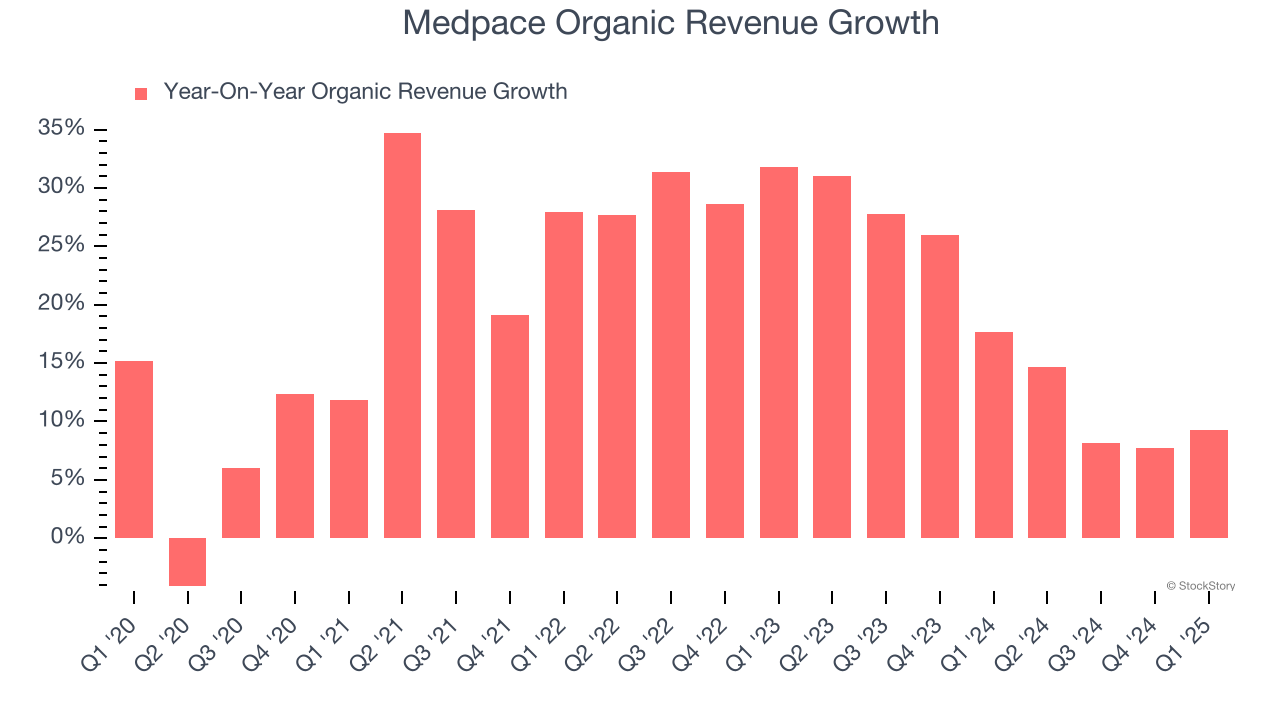
This quarter, Medpace reported year-on-year revenue growth of 9.3%, and its $558.6 million of revenue exceeded Wall Street’s estimates by 6%.
Looking ahead, sell-side analysts expect revenue to remain flat over the next 12 months, a deceleration versus the last two years. This projection is underwhelming and indicates its products and services will see some demand headwinds. At least the company is tracking well in other measures of financial health.
Here at StockStory, we certainly understand the potential of thematic investing. Diverse winners from Microsoft (MSFT) to Alphabet (GOOG), Coca-Cola (KO) to Monster Beverage (MNST) could all have been identified as promising growth stories with a megatrend driving the growth. So, in that spirit, we’ve identified a relatively under-the-radar profitable growth stock benefiting from the rise of AI, available to you FREE via this link.
Operating Margin
Operating margin is a key measure of profitability. Think of it as net income - the bottom line - excluding the impact of taxes and interest on debt, which are less connected to business fundamentals.
Medpace has managed its cost base well over the last five years. It demonstrated solid profitability for a healthcare business, producing an average operating margin of 19.2%.
Analyzing the trend in its profitability, Medpace’s operating margin rose by 2.4 percentage points over the last five years, as its sales growth gave it operating leverage. The company’s two-year trajectory shows its performance was mostly driven by its recent improvements. These data points are very encouraging and shows momentum is on its side.
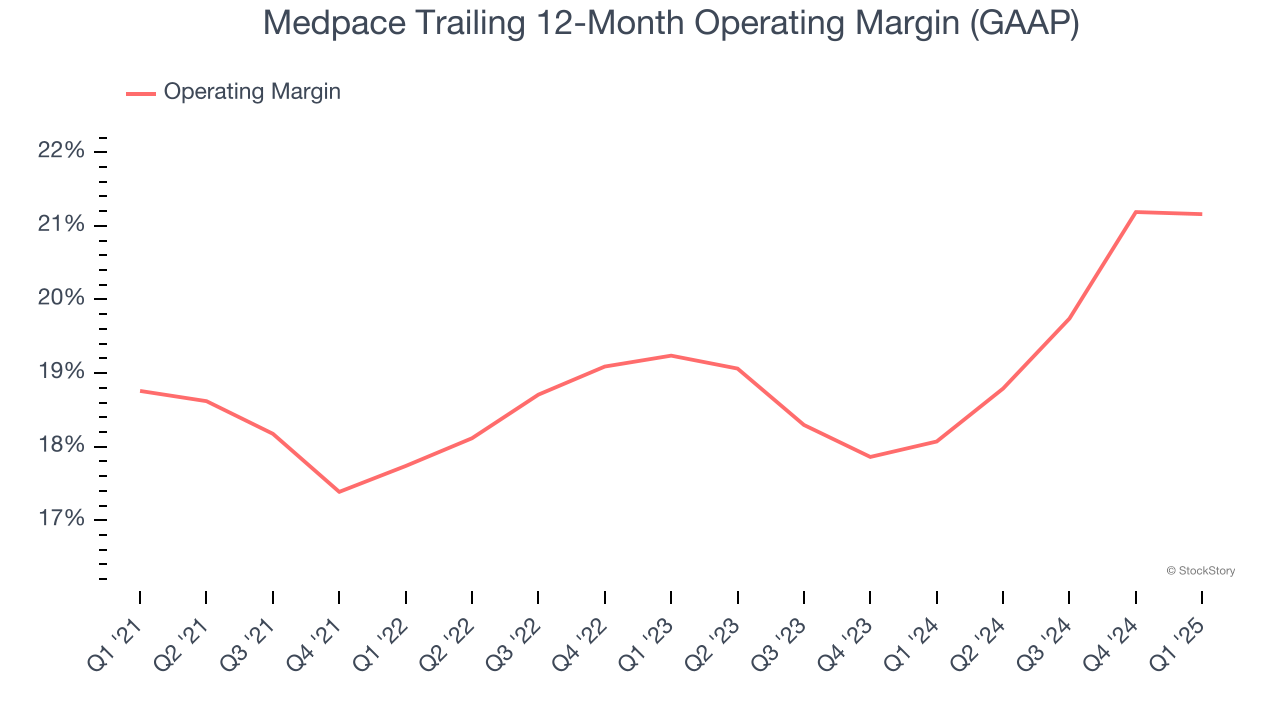
In Q1, Medpace generated an operating profit margin of 20.3%, in line with the same quarter last year. This indicates the company’s overall cost structure has been relatively stable.
Earnings Per Share
Revenue trends explain a company’s historical growth, but the long-term change in earnings per share (EPS) points to the profitability of that growth – for example, a company could inflate its sales through excessive spending on advertising and promotions.
Medpace’s EPS grew at an astounding 35.1% compounded annual growth rate over the last five years, higher than its 19.3% annualized revenue growth. This tells us the company became more profitable on a per-share basis as it expanded.
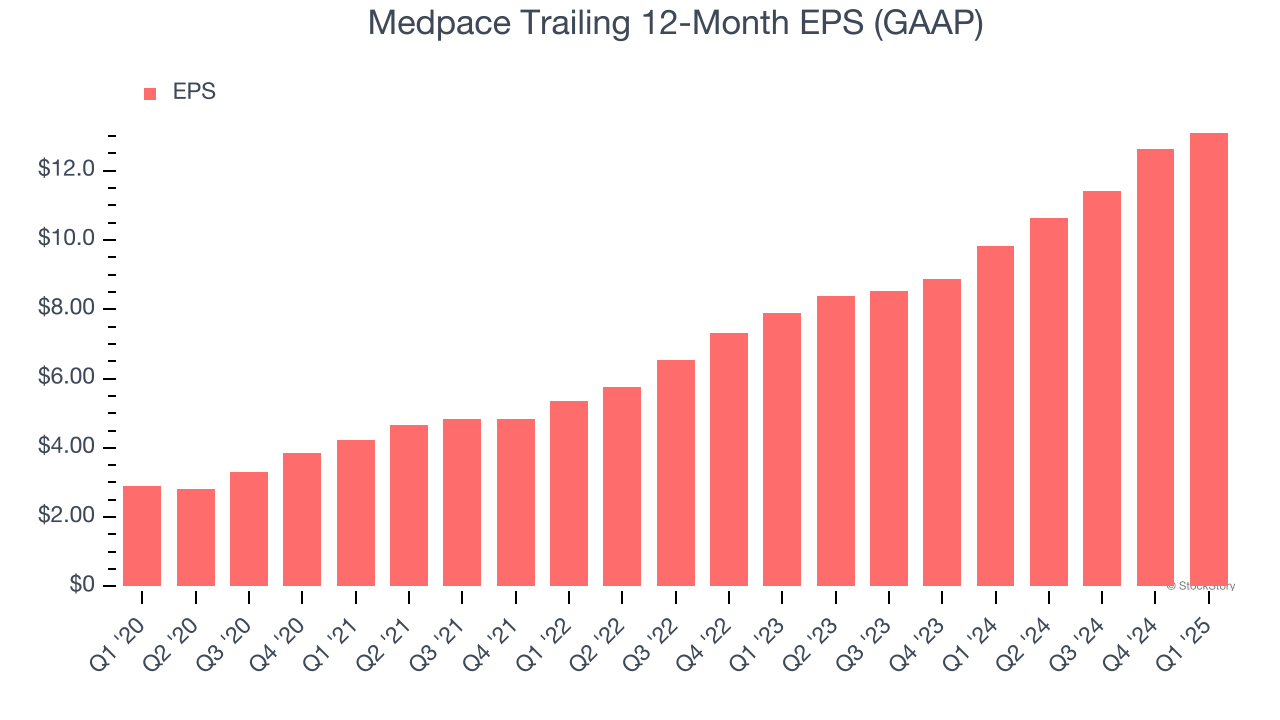
We can take a deeper look into Medpace’s earnings to better understand the drivers of its performance. As we mentioned earlier, Medpace’s operating margin was flat this quarter but expanded by 2.4 percentage points over the last five years. On top of that, its share count shrank by 18%. These are positive signs for shareholders because improving profitability and share buybacks turbocharge EPS growth relative to revenue growth. 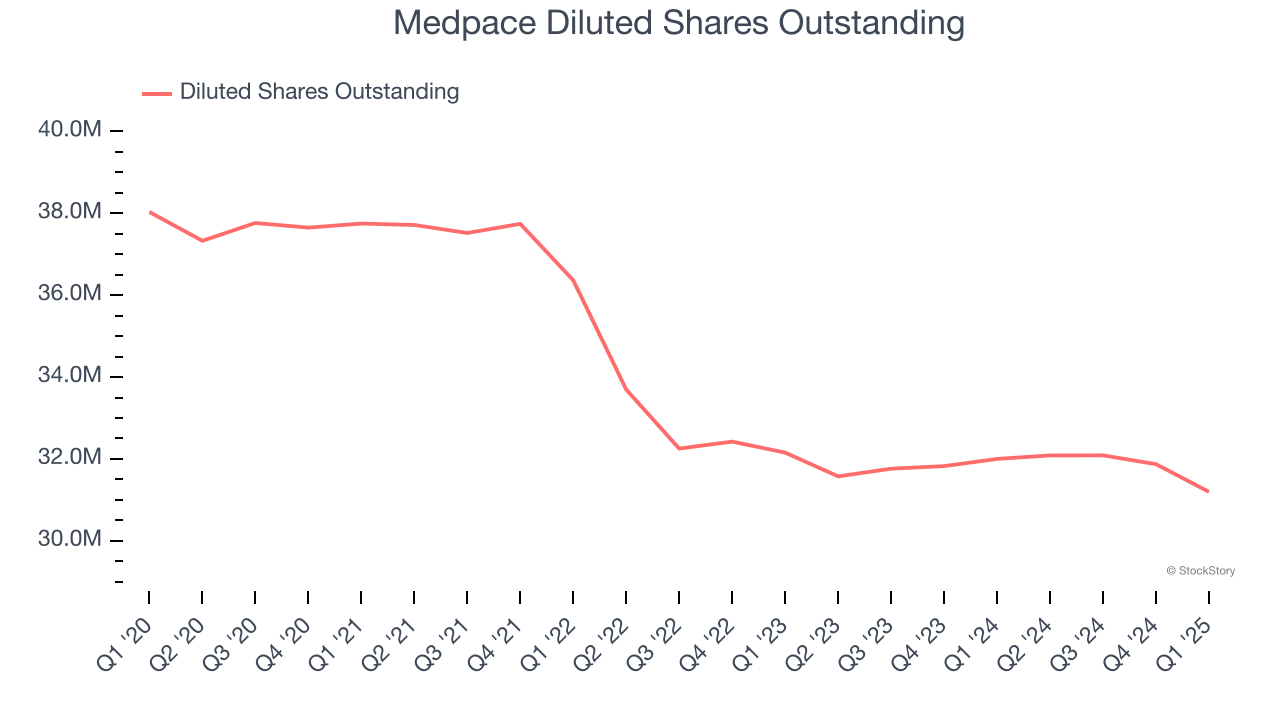
In Q1, Medpace reported EPS at $3.67, up from $3.21 in the same quarter last year. This print easily cleared analysts’ estimates, and shareholders should be content with the results. Over the next 12 months, Wall Street expects Medpace’s full-year EPS of $13.10 to shrink by 5.4%.
Key Takeaways from Medpace’s Q1 Results
We were impressed by how significantly Medpace blew past analysts’ organic revenue and EPS expectations this quarter. We were also glad it lifted its full-year revenue guidance. Zooming out, we think this quarter featured some important positives. However, the market seemed to be hoping for more, and the stock traded down 6.4% to $270.02 immediately following the results.
So should you invest in Medpace right now? If you’re making that decision, you should consider the bigger picture of valuation, business qualities, as well as the latest earnings. We cover that in our actionable full research report which you can read here, it’s free.