
Home energy technology company Enphase (NASDAQ: ENPH) missed Wall Street’s revenue expectations in Q1 CY2025, but sales rose 35.2% year on year to $356.1 million. Next quarter’s revenue guidance of $360 million underwhelmed, coming in 4% below analysts’ estimates. Its non-GAAP profit of $0.68 per share was 6% below analysts’ consensus estimates.
Is now the time to buy Enphase? Find out by accessing our full research report, it’s free.
Enphase (ENPH) Q1 CY2025 Highlights:
- Revenue: $356.1 million vs analyst estimates of $362 million (35.2% year-on-year growth, 1.6% miss)
- Adjusted EPS: $0.68 vs analyst expectations of $0.72 (6% miss)
- Adjusted EBITDA: $107.5 million vs analyst estimates of $115.2 million (30.2% margin, 6.7% miss)
- Revenue Guidance for Q2 CY2025 is $360 million at the midpoint, below analyst estimates of $375 million
- Operating Margin: 9%, up from -16.3% in the same quarter last year
- Free Cash Flow Margin: 9.5%, down from 15.9% in the same quarter last year
- Sales Volumes rose 10.7% year on year (-71.4% in the same quarter last year)
- Market Capitalization: $6.77 billion
Company Overview
The first company to successfully commercialize the solar micro-inverter, Enphase (NASDAQ: ENPH) manufactures software-driven home energy products.
Renewable Energy
Renewable energy companies are buoyed by the secular trend of green energy that is upending traditional power generation. Those who innovate and evolve with this dynamic market can win share while those who continue to rely on legacy technologies can see diminishing demand, which includes headwinds from increasing regulation against “dirty” energy. Additionally, these companies are at the whim of economic cycles, as interest rates can impact the willingness to invest in renewable energy projects.
Sales Growth
Examining a company’s long-term performance can provide clues about its quality. Any business can put up a good quarter or two, but many enduring ones grow for years. Over the last five years, Enphase grew its sales at an exceptional 14.3% compounded annual growth rate. Its growth beat the average industrials company and shows its offerings resonate with customers, a helpful starting point for our analysis.
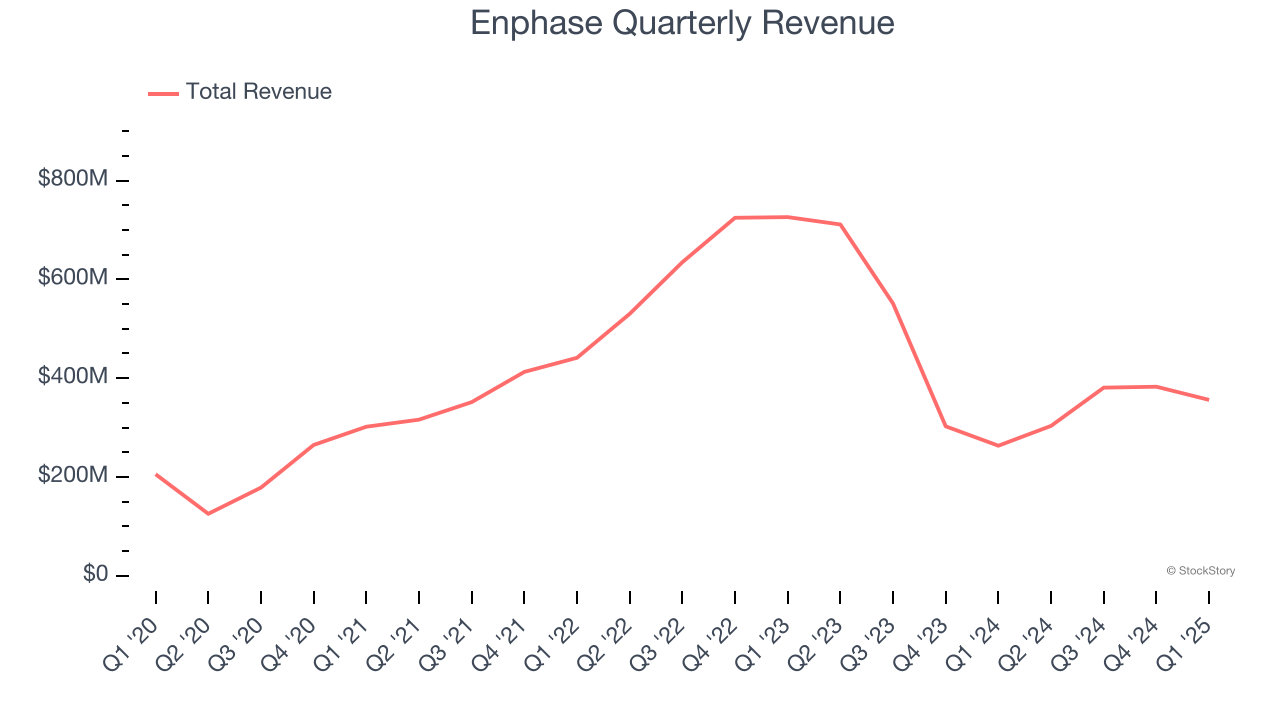
Long-term growth is the most important, but within industrials, a half-decade historical view may miss new industry trends or demand cycles. Enphase’s recent performance marks a sharp pivot from its five-year trend as its revenue has shown annualized declines of 26.2% over the last two years. Enphase isn’t alone in its struggles as the Renewable Energy industry experienced a cyclical downturn, with many similar businesses observing lower sales at this time. 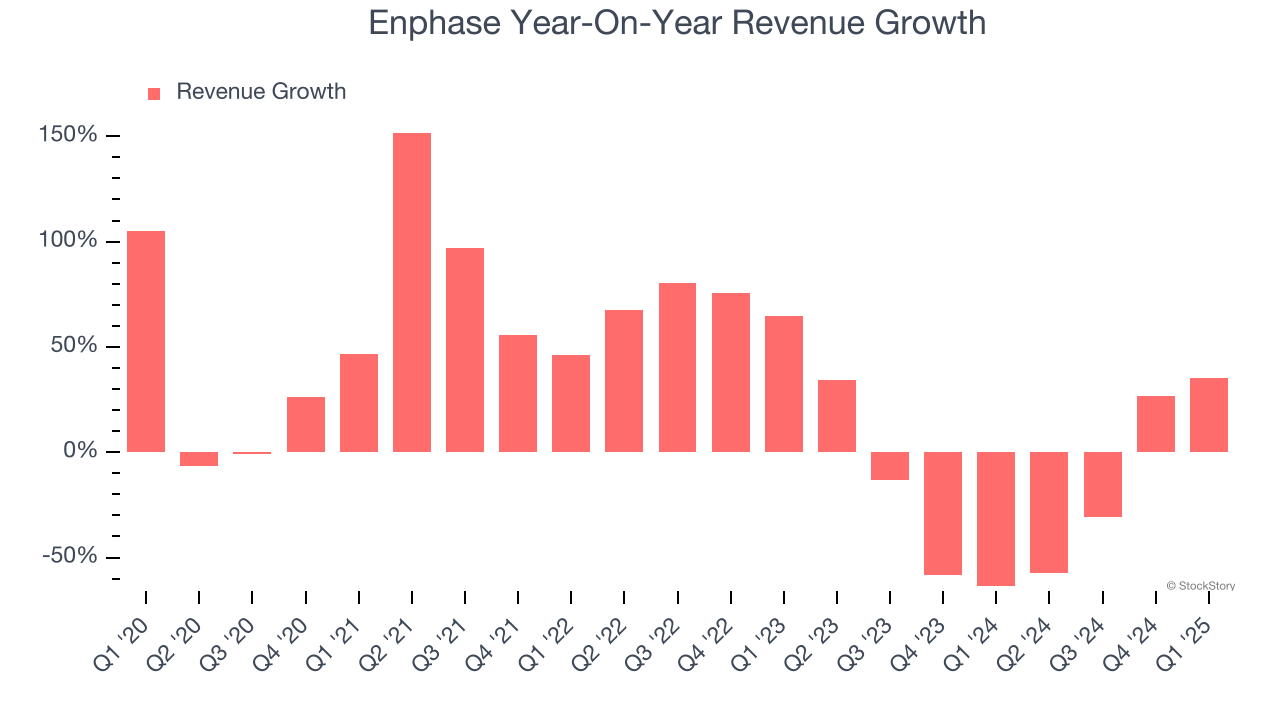
We can dig further into the company’s revenue dynamics by analyzing its number of units sold, which reached 1.53 million in the latest quarter. Over the last two years, Enphase’s units sold averaged 23.2% year-on-year declines. Because this number is better than its revenue growth, we can see the company’s average selling price decreased. 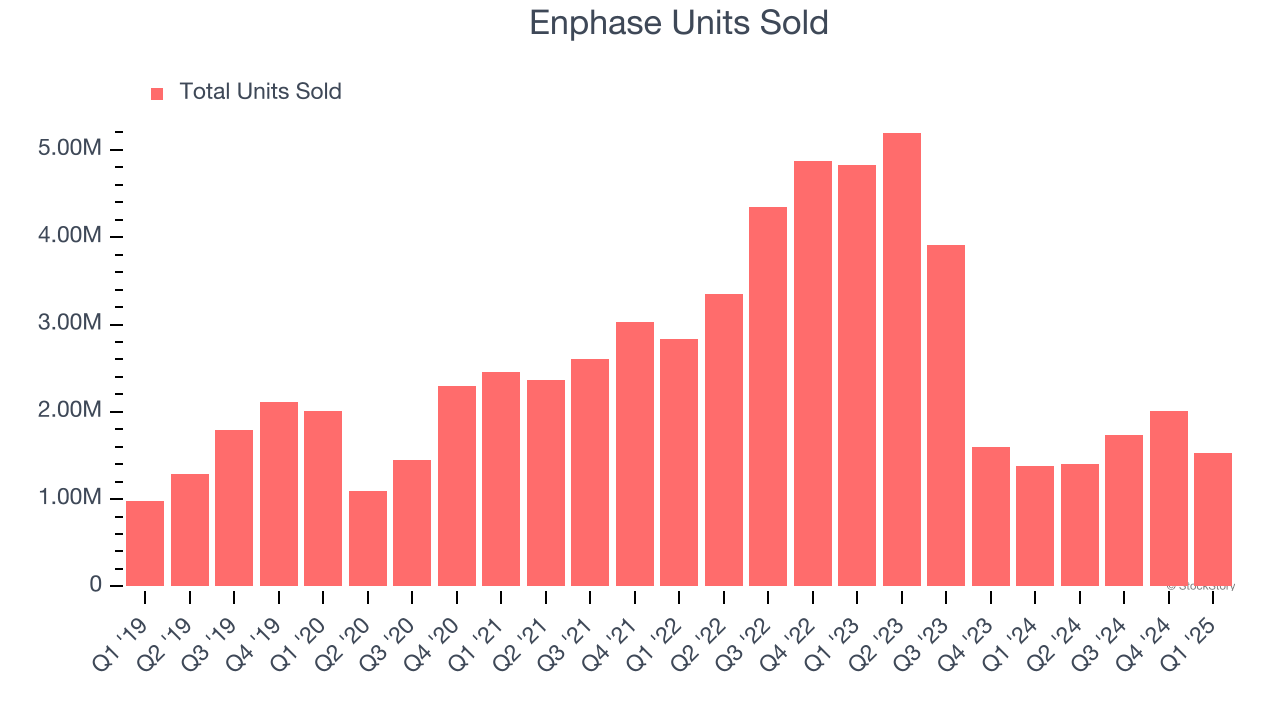
This quarter, Enphase pulled off a wonderful 35.2% year-on-year revenue growth rate, but its $356.1 million of revenue fell short of Wall Street’s rosy estimates. Company management is currently guiding for a 18.6% year-on-year increase in sales next quarter.
Looking further ahead, sell-side analysts expect revenue to grow 8.3% over the next 12 months, an improvement versus the last two years. This projection is above average for the sector and implies its newer products and services will spur better top-line performance.
Unless you’ve been living under a rock, it should be obvious by now that generative AI is going to have a huge impact on how large corporations do business. While Nvidia and AMD are trading close to all-time highs, we prefer a lesser-known (but still profitable) stock benefiting from the rise of AI. Click here to access our free report one of our favorites growth stories.
Operating Margin
Operating margin is one of the best measures of profitability because it tells us how much money a company takes home after procuring and manufacturing its products, marketing and selling those products, and most importantly, keeping them relevant through research and development.
Enphase has been an efficient company over the last five years. It was one of the more profitable businesses in the industrials sector, boasting an average operating margin of 14.5%. This result isn’t surprising as its high gross margin gives it a favorable starting point.
Looking at the trend in its profitability, Enphase’s operating margin decreased by 21 percentage points over the last five years. This raises questions about the company’s expense base because its revenue growth should have given it leverage on its fixed costs, resulting in better economies of scale and profitability.

This quarter, Enphase generated an operating profit margin of 9%, up 25.2 percentage points year on year. The increase was solid, and because its operating margin rose more than its gross margin, we can infer it was more efficient with expenses such as marketing, R&D, and administrative overhead.
Earnings Per Share
We track the long-term change in earnings per share (EPS) for the same reason as long-term revenue growth. Compared to revenue, however, EPS highlights whether a company’s growth is profitable.
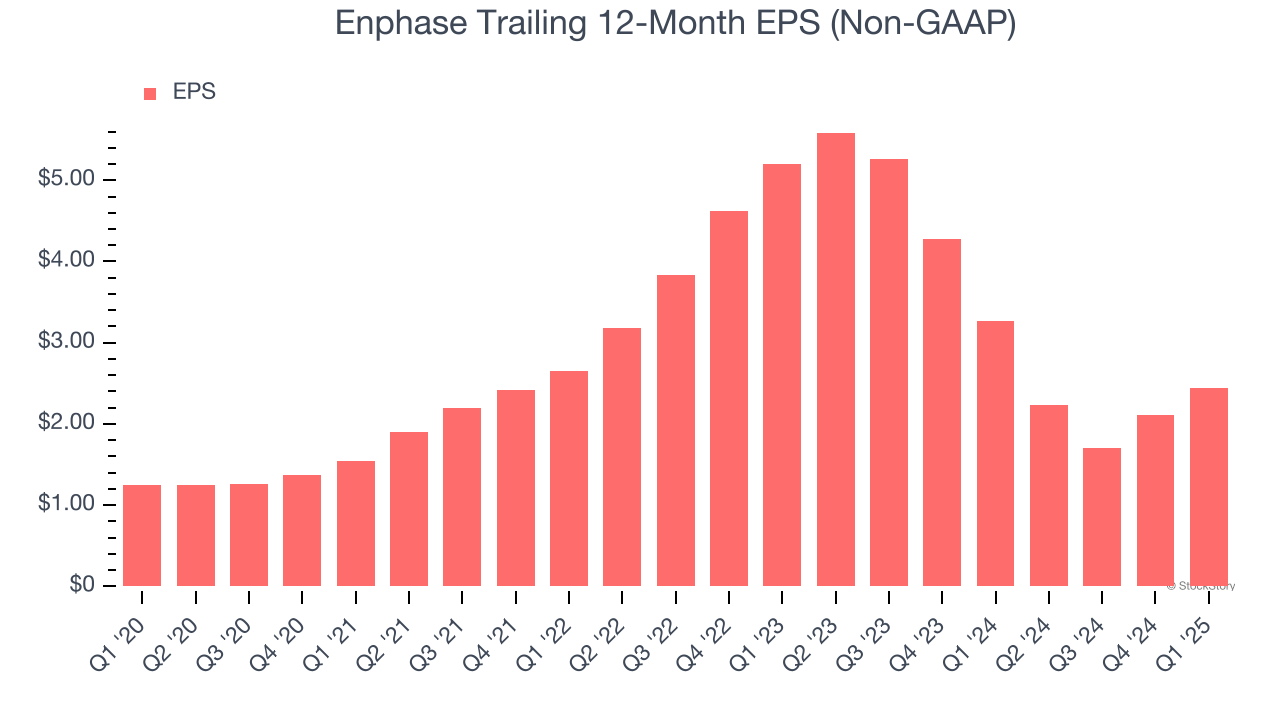
Enphase’s remarkable 14.3% annual EPS growth over the last five years aligns with its revenue performance. This tells us it maintained its per-share profitability as it expanded.
Like with revenue, we analyze EPS over a shorter period to see if we are missing a change in the business.
Enphase’s two-year annual EPS declines of 31.5% were bad and lower than its two-year revenue performance.
In Q1, Enphase reported EPS at $0.68, up from $0.35 in the same quarter last year. Despite growing year on year, this print missed analysts’ estimates, but we care more about long-term EPS growth than short-term movements. Over the next 12 months, Wall Street expects Enphase’s full-year EPS of $2.44 to grow 37.4%.
Key Takeaways from Enphase’s Q1 Results
We struggled to find many positives in these results. It missed across all key metrics, and its quarterly revenue guidance fell short of Wall Street’s estimates. Overall, this was a softer quarter. The stock traded down 11.4% to $47.42 immediately after reporting.
Enphase may have had a tough quarter, but does that actually create an opportunity to invest right now? We think that the latest quarter is only one piece of the longer-term business quality puzzle. Quality, when combined with valuation, can help determine if the stock is a buy. We cover that in our actionable full research report which you can read here, it’s free.


